Can the Sonic AI gold record be what it is sold as?
Account Myfxbook 12076857Instrument XAUUSD (gold)History 4 Nov 2024 – 19 Oct 2026Trades 637Recorded profit $34,908.40
SectionOverview
One trade tells the story
At 24×, one trade in this record would have wiped out every investor. Nobody lost a cent.
Opened in June 2025, trade #130 went as far as $12,890 against the account, about 10% of it. On a 24× account, the product investors are sold through TAG, a 10% move against you is 240% of your money. Every 24× balance would have been wiped out long before the trade ended. Instead, after 91 days, it was "closed" on a Saturday, when the gold market is shut, at a price $280 from anything gold traded that week, for a loss of $4. Balances kept rising.
That cannot happen in a real market. It can only happen inside the broker's own books.
We ran six tests on the account's public history: all 637 trades from 4 November 2024 to 19 October 2026. The record failed all six.
Don't take our word for it. Check it yourself.
Everything this site relies on is here to download: the full trade list, all 33 pages of the account history, the analysis workbook with every formula, TAG's wallet addresses and payment data, and the promoted copies of the trades. Use this site as a starting point, then check it with your own tools, your own adviser or your own AI assistant, whenever you want.
Why this site exists. I was invited to Dubai to invest in this strategy. I asked the questions a professional investor asks, and the answers did not hold up, so I tested the record myself.
Phase 1 · 4 Nov 2024 – 20 Aug 2025
164 trades$16,675 profitabout 1 hour per trade
✕Three of five periods are no better than random entries.
✕76 of 328 fills match no price gold traded within a minute.
✕Four impossible trades: a Saturday close (#130), fills $130 from the market (#249), a fill while the market was closed (#2), a close above the day's high (#70).
Phase 2 · 12 Sep 2025 – 19 Oct 2026
473 trades$18,234 profitminutes per trade
✓98–100% of fills match a real price in the same minute.
✕Wins 82–94% of trades where random entries win 18–36%.
✕Entries filled at prices 30–60 seconds old, just before the market moves their way.
Whole history · both phases
✕On the ~$500 million said to be in Sonic, at 24×, every trade is about 13 times the world's gold volume per minute; costs exceed profit.
✕The probability that this is real market trading at the claimed size is effectively zero.
TAG's own payment wallets have taken in $1.14 billion of crypto since October 2024 (see Follow the money), and investors are offered deposits "amplified" up to 24×. This page tests what the public record means at that size, and gives you everything you need to check it yourself.
The biggest risk
What happens if everyone asks for their money at once
If balances are not backed by trading profits, the only money available to pay withdrawals is what is left of recent deposits. That works while new money arrives faster than money leaves. When many people ask at the same time, the first are paid and the rest are not. The people who ask last lose the most.
What holds up, and what does not
Checks out
✓The 637 trades, $34,908.40 profit and all deposits and withdrawals match the Myfxbook page exactly (read 20 October 2026).
✓Since September 2025, 98–100% of fills match a price gold actually traded at in the same minute.
✓The broker's server clock is consistent (UTC+2 winter, UTC+3 summer, switching on US dates).
✓All 641 rows to 5 October also match the 33 history pages in the evidence archive, one by one, and the 11 trades since then match the update page captured on 20 October.
Does not
✕A Sharpe ratio of 24 since November 2025, about 12 times the best-known trading fund.
✕The win rate is 8–22 standard deviations beyond chance, and the edge comes from trading at old prices.
✕From November 2024 to August 2025, 76 of 328 fills match no price gold traded within a minute.
✕A position $12,890 under water was "closed" on a Saturday at a price $280 from the market, for a $4 loss.
✕On the ~$500 million said to be in Sonic, at 24×, each trade is about 13 times all the gold the world trades in a minute. The costs exceed the profit.
✕At 24× leverage, that one hidden loss would have wiped out every amplified account.
Two things to know about the "verified" labels. Myfxbook's track-record check confirms that the history it shows matches the broker's own records; it does not check that trades reached the market. And the account was added to Myfxbook on 15 June 2026, 19 months after trading started, so everything before that date was loaded in one go rather than tracked as it happened.
Your email is used only for these updates. You can unsubscribe at any time.
Videos
Ten short videos, about two minutes each, made from the same public data as this site. Watch them here, or download them to share.
Video language
The videos are in English, Spanish and German. Their figures are as of early October 2026 (626 trades to 5 October); this site has the latest figures. The website tour was recorded before some sections were added, and shows the English site.
What this is about
2:53
An introduction: the Sonic AI gold strategy, the broker TAG Markets, and what the public record and wallets show.
One trade tells the story
1:47
Trade #130: a position $12,890 under water, closed on a Saturday for a $4 loss.
What 24× means
2:11
How the 24× multiplier works, who gets it, and what it would do to an account.
Too big for the gold market
1:55
At the size of the money said to be in Sonic, each trade would be many times the gold the world trades in a minute.
Follow the money
1:55
What TAG’s public crypto wallets show: how much came in, how much went out and how little is held.
How it ends, and what to do
1:59
How schemes paid from new deposits end, the warning signs, and the steps that protect you.
Check it yourself with AI
1:39
How to give the evidence pack to an AI assistant and run the tests yourself.
What they show you in the room
1:43
Screens, bank accounts and MetaTrader shown in a meeting are not evidence. What would count.
The card in the same channel
2:13
The BIX crypto wallet and debit card promoted in the same community channel, and why it matters.
A tour of this website
4:26
A walk through the sections of this site and how to use them.
Contact and updates
Get updates, correct us, or tell us what you know
This site is kept up to date as new evidence comes in. Write to us to join the email list, to point out a mistake, or to send information.
Our email addressbehindtagmarkets@proton.me
Address copied. Paste it into a new email, with the subject:
Copy the address above and write to it from your email, with the subject:
Get updates
Send us an email with the subject "Updates" and we will add you to the list. You will receive:
TAG Markets money flows, tracked on-chain
Legal and regulatory developments
New tests on Sonic AI, and on other strategies
Important changes, as soon as they happen
Send a correction
If something on this site is wrong, tell us what it is, where it is, and what shows it, with a link or a document if you can. We check every correction, fix what is wrong and list it in the corrections log. A company or community named here can send its reply, and we will publish it in full.
Share information
Terms in writing, presentations, screenshots, withdrawal problems, or anything else that helps others check the facts. We never publish who sent something.
Protect yourself when you send something
Crop screenshots to the part that matters, and cover your name, account number, phone number and photo.
Never send passwords, codes, card numbers or ID documents. We will never ask for them.
If you want, write from an email address that does not show your name.
We remove hidden data (like device and location details) from every file before anything is published.
We use your email address only to reply to you and to send the updates you ask for. We do not share it with anyone. To stop the updates, reply "Stop".
Why this site exists
I was invited to invest. I asked questions first.
I was invited to Dubai to look at this strategy as a potential investor. I visited the broker's office in Al Habtoor Business Tower and met members of its management team.
I have worked for many years with brokers, trading strategies, banks and liquidity providers, and I manage investment capital for others. Before investing anywhere, I ask the questions any professional investor would ask: where the trades go, who is on the other side, where the money is held, and what licence covers it.
The answers I received did not hold up. They were general or changed the subject, and none came with documents. So I did my own research: I tested the strategy's public track record, trade by trade, against independent market data. Everything I found is on this site, together with the data and the tools to check it yourself.
The questions I asked
I put these questions to TAG Markets' management, to the person presented to me as the company's founder. His answers are given as closely as I recorded them, next to what the public evidence shows.
Question
Answer received
What the evidence shows
Who are your liquidity providers, and can I see execution reports for the strategy's trades?
"We have over 20 LPs. Execution reports are confidential and cannot be shown."
None of the 20 was named. A confirmation from a single one of them, that it filled these trades, would settle the question; no such confirmation has been shown. Brokers give execution records to auditors and regulators as a matter of course.
Are clients' trades passed to the market, or kept on your own books?
"The Sonic strategy is passed to the market. It's A-book."
If every trade went to the market, the record could not contain a position closed on a Saturday, when gold does not trade (#130), and at about $500 million and 24× each trade would be about 13 times the gold the whole world trades in a minute (six tests).
How does the 24× leverage work, and who carries the risk if the market moves against it?
"Our LPs provide the difference to complete the 24× on every dollar, and also carry the risk."
Liquidity providers fill orders against margin the broker posts; they do not normally put up 23 dollars of their own for every client dollar and take the losses. On about $500 million that would be roughly $11 billion of their capital. At its worst, trade #130 alone would have cost them more than twice the investors' money.
Where are client funds held, and are they kept separate from the company's money?
"In the bank."
No bank was named and nothing was said about keeping client money separate. The crypto wallets that collected $1.14 billion hold at most about $50 million (follow the money).
Which licence covers your activity with clients in the UAE?
"We have a licence in Mauritius. We don't currently have a licence in the UAE but are in the process of getting one."
By their own answer, there is no UAE licence. Regulators in Austria, Luxembourg and Québec have since warned that Tag Markets is not authorised there (for regulators).
Any investor can ask the same questions. A legitimate broker answers them with documents.
I did not invest. I am publishing this because thousands of people are putting money into this strategy, many of them with far less experience of how brokers work, and they deserve to see what I saw before they decide.
I have no financial interest in any competing broker or strategy.
Conclusion
What all the evidence adds up to
≈ 0%
Real trading in the gold market at the size of the money paid in
About 1 chance in 250,000. The record contains trades no market can produce, an edge that only exists against the broker's own lagging prices, and trades too large for the world's gold market at the size of the money paid in.
59%
Most likely: the broker keeps the trades on its own books, and withdrawals are paid from money deposited by newer investors
This is how a Ponzi scheme works. Profits are shown on screen but not earned in the market, and the money that pays people out comes from people who joined later.
39%
Next: the balances on screen are bigger than the money behind them
Amplified or credited balances exist only on screen. The wallets that collected $1.14 billion hold at most about $50 million. The practical risk is the same: the money shown is not all there.
2%
The broker pays from its own money
Not realistic. The product investors buy is 24×, so that is the bill: about 27% a month, or about $270 million a month for every $1 billion of balances. At 24×, the profit booked in September 2026 alone was about $130–240 million (investors' 70% plus commissions and the broker's fee), three to five times the at most $50 million held in the wallets, and it keeps growing as people reinvest. Paying that for a year would take several billion dollars of the broker's own capital. No broker of this kind has that, so the money has to come from somewhere else: new deposits.
98% combined chance that investors' balances are not backed by profits from trading gold.
The bottom line
24× is why people join. It is also why this cannot end well.
1
On its own, the strategy is not attractive
The Sonic record makes about 1.1% a month. $1,000 copied for its whole 23 months becomes about $1,200 after the profit share. Few people would travel to Dubai or recruit their friends for that.
2
24× makes it irresistible
At 24×, every month's result is multiplied by 24: about 27% a month. The investor keeps 70%, about 19% a month; the network and the broker take the rest. Reinvested, the investor's share turns $1,000 into about $56,000 on screen in 23 months, and the scheme books about $257,000 in total on it. That is what is being sold, and why money is pouring in.
3
24× cannot be real trading
At 24×, trade #130 alone would have wiped every account out, and trading costs overtake the recorded profit from only about $30 million. So the 24× profits are not earned in the market. They are entries in the broker's own books: promises, not money. Saying the 24× is a "credit" or "bonus" only confirms it: then the profits are paid by the broker, and the only money it has to pay them with is other investors' deposits.
4
The promises grow faster than the money
Most people reinvest, so the promise compounds. Commissions are withdrawn or reinvested too, so all of it is owed or paid out. In September 2026 the 24× profit booked was about $130–240 million, as much as or up to twice all the new crypto paid in that month (about $125 million, the Sonic half of $250 million). Balances owed on the Sonic half alone are about $0.55–0.95 billion; the wallets hold at most about $50 million.
5
It only works while new money keeps accelerating
Inflows must keep growing about 20% every month just to keep paying. If they level off, the cash runs out in about five months; if they fall, about four; after a shock such as regulator action, about two. If new money stopped, what is owed would double about every three months. The more people join, the bigger the hole when it stops.
Figures: the Myfxbook record ×24, crypto flows in TAG's payment wallets (card and bank deposits would make them larger), and the scenario model on this site. They describe what follows if the profits are booked rather than earned, which is what every test on this site points to. TAG can disprove it by showing where the money behind the balances is held.
Two possible stories. Neither adds up.
Either the 24× is really traded, or it is not. Both end in the same place.
Story 1
"We really trade the money at 24×"
Management says about half of what came in, roughly $500 million, is traded with Sonic. At 24× that is $12 billion in the market. Each of the strategy's trades would be about $4 billion of gold, 29 tonnes, sixteen times what the whole world trades in an average minute, held for a few minutes.
The market cannot absorb that without moving the price against you. Our cost model puts the price impact at about $13 billion over the record's history, against about $3 billion of profit: a loss of nearly $10 billion. And trade #130 alone would have wiped out every 24× account, whatever its size.
Does not add up: the market is too small, the costs are too high, and the record's own losing trade would have ended it.
Story 2
"We trade the real money; the 24× is only on screen"
Then only the record's real result is earned: about 1.1% a month. On $500 million, after trading costs, that is about $23 million over the whole history. But balances are credited the 24× result: about $3.2 billion over the same months.
To produce the 24× numbers for real, they would have to trade 24 times bigger, which is Story 1. If they don't, the extra $3 billion is a number on screens, paid out when people withdraw from other investors' deposits.
Does not add up: the profits shown are about 24 times what the money can earn. That is how a Ponzi scheme works.
Where could a real 24× have worked? Only at a tiny size.
The same record, really traded at 24×, with different amounts of client money. Trading costs use the same market model as the size test: the bigger each trade compared with what the market trades, the more the price moves against you.
Client money
In the market at 24×
Typical trade
Gold per trade
Compared with world volume per minute
Profit after costs, Nov 2024 – Oct 2026
$100,000
$2.4M
$0.8M
0.01 t
under 1%
+$0.6M
$1 million
$24M
$8M
0.06 t
3%
+$5M
$10 million
$240M
$84M
0.6 t
32%
+$27M (the most it can make)
$30 million
$720M
$250M
1.7 t
about the same
about $0 (costs eat all profit)
$50 million
$1.2B
$420M
2.9 t
1.6×
−$92M
$100 million
$2.4B
$840M
5.8 t
3×
−$530M
$500 million (≈ the share said to be in Sonic)
$12B
$4.2B
29 t
16×
−$9.9B
$1.14 billion (all paid in)
$27B
$9.6B
66 t
36×
−$38B
Up to about $10 million of client money, a real 24× could in principle trade this record and keep most of its profit.
At about $30 million, each trade is as big as what the whole world trades in a minute, and trading costs eat all the profit. In the most recent months the limit is about $50 million.
Above that, every extra dollar loses money. TAG's wallets alone took in $1.14 billion, about 40 times the limit.
And even at $100,000, a real 24× account would have been wiped out by trade #130, which went about 10% against the account: 240% at 24×.
In plain words
A real 24× version of this strategy could, at most, have handled a few tens of millions of dollars, about 1–3% of the money that came in, and only if trade #130 had never happened. For everything above that, the 24× profits cannot come from the market. They can only come from other people's money.
Price-impact model: the square-root law used under Six tests, with World Gold Council volumes by hour. Profits are not reinvested in this table. Figures are rounded.
Why this matters now
Schemes like this do not last
A scheme that pays withdrawals from new deposits keeps working only while new money arrives faster than money leaves, after commissions, events and other costs. The amount shown on investors' screens grows every month; the money behind it does not. When inflows slow, or many people ask for their money at once, withdrawals are delayed, limited and then stopped. History shows these schemes end, often suddenly, and the people who find out last lose the most.
How we got here: six tests, six failures
✕Win rate. Wins nearly 9 trades in 10 where random entries with the same targets win 1 in 4.
✕Sharpe ratio. Scores 24; the best funds in history score 2 to 3.
✕Timing. Fills at prices 30–60 seconds old, just before the market moves its way.
✕Trade #130. A $12,890 loss closed on a Saturday at a price the market never traded, for $4.
✕Size. On the ~$500 million said to be in Sonic, at 24×, each trade would be 16 times the world's gold volume per minute.
✕Leverage. At 24×, trade #130 alone would have wiped out every amplified account.
What would change this conclusion
Records showing each trade was passed to an outside liquidity provider at the recorded prices, bank statements showing withdrawals paid from trading gains, and a broker explanation of trades #130 and #249 with its own logs. None has been published.
What to do
Do not add money.
Ask for your money back, starting with what you put in.
Save your statements and proof of every deposit and withdrawal today.
Report to your financial regulator; early reports help protect everyone.
Speak to a lawyer, alongside your withdrawal, not instead of it.
The test that costs you nothing
Take your money out now. Stay out two to three months, and watch.
Do not put money back unless TAG produces official proof: liquidity-provider confirmations, the total money in Sonic, audited accounts, a valid licence. Payments on time alone prove nothing. If you hit delays, new checks, fees, "special offers" or warnings that you will lose your place, you got out in time. We will keep tracking the wallets and the legal side and publish what we find, whichever way it points.
These probabilities are structured judgments from the evidence, not measurements; read the order, not the decimals. Every number and test on this site can be checked with the trade list, the archived pages, the workbook and your own AI assistant. This is not financial or legal advice.
Six tests on 637 trades
Each test compares the record with what real prices, chance and the best traders on record produce. Work through them in order, or jump to any one.
Win rate vs chance
82–94%
That is how often the strategy has won in each period since September 2025; across the full history since November 2024 it won 83% of 637 trades. We gave random entries the strategy's own average win and loss as targets, during the same hours, on real minute-by-minute gold prices. They won 18–36% of the time.
A defender will say a good strategy doesn't depend on luck, and that is right. This test does not say the results are luck. It shows they are not: a gap of 8 to 22 standard deviations means something systematic is producing them. The question is what. Three things make this record unusual even for real skill:
High win rate and small losses at the same time. A high win rate is usually bought with big losses: take profits quickly and let losing trades run. Here the average win is about twice the average loss ($4.80 against $2.20 per ounce in the latest period), and the strategy still wins 88% of the time.
Far beyond the best traders on record. At Renaissance Technologies, whose Medallion fund is the most successful trading fund known, co-CEO Robert Mercer described the firm as right about 50.75% of the time.
The edge appears only in very short trades. When trades lasted an hour or more (Nov 2024 – Aug 2025), three of five periods are indistinguishable from chance. Once trades shrank to minutes, the gap jumped. Very short trades are where a few seconds' difference in prices matters most.
The next finding shows where the edge comes from.
Random entries, same targetsStrategy
All ten periods of the full history, November 2024 to October 2026. Numbers on the right are standard deviations above chance. Random entries need minute-by-minute prices, which we hold to 5 October 2026, so this chart covers the 626 trades to that date.
In plain words✕ Fails this test
Picking trades at random with the same profit targets wins about 1 time in 4. This strategy wins nearly 9 times in 10. That gap is far too big for skill or luck: something in how the trades are filled is doing the work.
Test 1 of 6
Sharpe ratio
24.3
The Sharpe ratio measures return against the ups and downs taken to get it. It is how professional investors compare traders. Above 1 is good. Above 2 is excellent. Above 3 is so rare that analysts check the data before believing it.
This account's Sharpe ratio is 6.1 over its full history and 24.3 from November 2025 to October 2026, more than 11 months and 250 trading days. In its most recent period, April to October 2026, it is 32. That is roughly 12 times Renaissance's Medallion fund over the long run (about 2) and more than 7 times Millennium (about 3.2), the best-known records in the industry.
"Short periods are noisy." The 24.3 covers more than 11 months. Even the bottom of its 95% confidence range is 21.
"We keep risk low, so the ratio is high." Risk is low here because losses are a third of what gold's own movement would produce, which is the timing finding again.
"Our account is small." Size cannot change a Sharpe ratio. Doubling every trade doubles both the return and the swings.
"It could be luck." Keeping every trade's time and size but flipping its direction at random, 1,000 times, the full-history Sharpe almost never passed 2.2. The record is 6.1.
Calculated from daily closed-trade results with no cash rate; with a 4% cash rate the figures are 4.4 and 16.0. Closed-trade results hide open losses: if #130 was a real position, the full-history Sharpe falls to 1.8.
Annualised Sharpe ratios. Benchmarks cover their own periods: S&P 500 and gold for the same 23 months; typical hedge funds over the last decade; Millennium about 1997–2021; Medallion 1988–2018 before fees. The dashed line at 3 is where analysts start checking the data.
In plain words✕ Fails this test
The best trading funds in history score about 2 to 3. This account scores 24. No known trader has come close. Results this smooth are a warning sign that the record does not reflect real market risk.
Test 2 of 6
Where the edge comes from
$1.48
The median move in the trade's favour within one minute of entry. Random entries at the same times moved $0.35 the other way. In 111 trades with second-by-second data, entries were filled about $0.15 better than the live price at that second, roughly the price from 30–60 seconds earlier. Exits show no such gap.
The trades also barely went against the position: a median of $0.96, against $3.36 for random trades of the same length. A quarter never went more than 5 cents against.
This is the pattern of trading against a broker's lagging price feed. A bank or liquidity provider on the other side would reject or re-price those fills. A broker that keeps the trades on its own books can choose to honour them.
The seconds-level result rests on a sample of 111 trades. Treat it as strong, not final.
Worst move against the position during the trade, all 624 checked trades.
In plain words✕ Fails this test
The strategy gets prices that were already 30–60 seconds old, just before the price moves its way. It is like placing a bet after seeing the result. A real market would refuse those trades; only a broker paying from its own pocket would accept them.
Test 3 of 6
Trade #130
$12,890
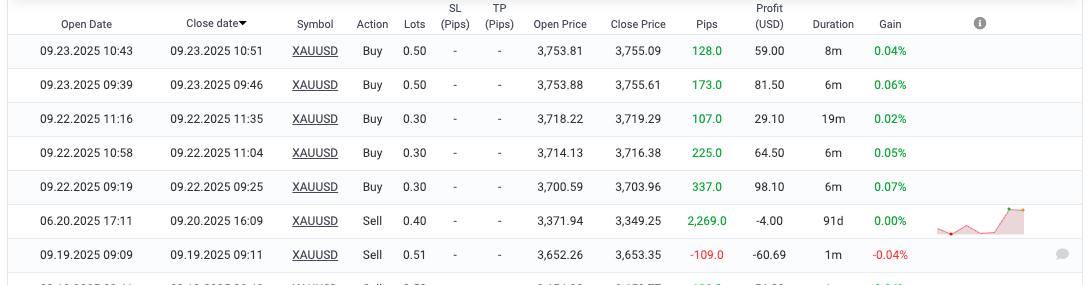
On 20 June 2025 the account bought gold at 3,349.25 and sold it an hour later at 3,371.94 for $903.60 profit (#129). Seven seconds later, #130 opened a 0.40-lot short at exactly that closing price.
#130 stayed open for 91 days. Myfxbook's excursion data puts it $12,890 under water at its worst, about 9.9% of the account. Then it "closed" on Saturday 20 September 2025, when gold does not trade, at 3,349.25: the exact opening price of #129, about $280 below any price gold traded that week and about $340 below Friday's close. It booked a loss of $4.
#
Opened
Closed
Side
Lots
Open
Close
Profit
129
Fri 20 Jun 2025 16:09:42
Fri 20 Jun 17:11:17
Buy
0.40
3,349.25
3,371.94
+903.60
130
Fri 20 Jun 2025 17:11:24
Sat 20 Sep 16:09:42 market closed
Sell
0.40
3,371.94
3,349.25
−4.00
Screenshot of the Myfxbook history page (page 24), taken 8 October 2026. The small chart on the right is Myfxbook's record of the position's floating profit and loss.
Myfxbook's own pages show the same trade from other angles: its day-of-week chart has one losing trade on a Saturday; its margin chart covers exactly 20 June to 19 September 2025, the 91 days #130 was open; and the account's published maximum drawdown of 0.86% leaves the $12,890 out entirely.
There are two possible readings. Either the position was real and its loss was erased by a "close" at a price the market never offered, or the entry was created without a real position behind it. Myfxbook may have calculated the $12,890 from market prices when the history was loaded, so we cannot tell which. Neither can happen in a real market. Both can happen only inside the broker's own books.
Trade #249 is similar: it was credited +$63 at prices $126–134 away from where gold was trading, when the recorded prices give −$2.20.
Possible explanations from the broker or the strategy's promoters, and what the evidence says about each: see below.
In plain words✕ Fails this test
A trade losing $12,890 was closed on a Saturday, when the gold market is shut, at a price $280 away from reality, and booked as a $4 loss. That cannot happen in a real market. It can only happen inside the broker's own records.
Test 4 of 6
Size
29 t
That is the average recent trade at the 24× investors are sold, on about $500 million: roughly half of the $1.14 billion paid into TAG's crypto wallets, which is the share management says is traded with Sonic. The whole world trades about 2.2 tonnes of gold in an average minute, counting every exchange and bank (World Gold Council, 2025). Each trade would be about 13 times that, and about 16 times the volume in the hours these trades were placed. Many of them lasted two or three minutes.
On a lenient cost model, moving the price would cost about $13 billion over two years against about $3 billion of recorded profit: a loss of about −$9.9 billion. Even the few accounts at 12× would lose about $3 billion. Without any leverage at all, costs would still eat more than 80% of the profit. At 24×, costs overtake the profit from only about $30 million; at 12×, from about $60 million.
Tonnes of gold. The scale is logarithmic: each gridline is ten times the last.
In plain words✕ Fails this test
With about $500 million at the 24× investors are sold, every trade would be more than ten times all the gold the whole world trades in a minute. Simply buying would push the price against you. The profits shown cannot be earned at this size, at 24× or even at 12×.
Test 5 of 6
Leverage
236%
That is how much of a 24× deposit trade #130 would have lost at its worst, if the position was real. Any account following this one at 24× in the market would have been liquidated in summer 2025. If investor statements show no loss in that period, either their money was never exposed to the market, or #130 was never a real position.
In plain words✕ Fails this test
At 24×, the losing trade #130 alone would have wiped out every account copying this strategy in the real market. If investors' accounts never showed that loss, their money was never really in the market.
Test 6 of 6
Where could the profit come from?
Source
Can it explain the claims?
Verdict
The gold market (trades passed to outside counterparties)
Saturday fills, a vanished loss and fills $130 from the market are impossible in a real market. On the ~$500 million said to be in Sonic, at 24×, the costs exceed the profit several times over.
No
The broker's own money (trades kept on its own books)
At 24×, the product investors actually buy, about $270 million a month for every $1 billion of balances: about $130–240 million in September 2026 alone, against at most about $50 million in the wallets. No broker can pay that from its own capital.
Not at this size
Losses of the broker's other clients
How a normal broker book works. It would need very large client losses, and a broker would not normally keep paying a strategy that wins this consistently.
Partly possible
New deposits
The only source that grows with the claims, and it fits recent large inflows. It also explains why problems would not show until inflows slow.
Fits
Balances bigger than the money
The wallets that collected $1.14 billion hold at most about $50 million. Amplified results may show on screens without the money behind them.
Fits
Could it be genuine skill?
At the size of the money paid in: no, whatever the skill
Even a trader who knew the future could not produce this record with the roughly $500 million said to be in Sonic, at 24×. The problem is not predicting the price. It is that the trades themselves would move it. A typical recent trade at that size is more gold than the whole world trades in a minute, and filling it takes longer than the trade lasted. A perfect forecaster would still pay that cost, and the fill prices would look nothing like the ones recorded.
At the account's real size: one reasonable explanation
The tests point to trading against the broker's lagging prices. A move shows up first on a fast price feed, and the order is filled at the broker's older quote. That fits all four timing results: entries about $0.15 better than the live price, a $1.48 move in the trade's favour within a minute, very small moves against the position, and no such gap on exits.
This is a known technique, sometimes called latency arbitrage. It can make a small account look extraordinary. It also cannot grow: real liquidity providers can reject fills at prices that have already moved, so only a broker keeping the trades on its own books, and choosing to pay them, would honour them month after month.
Other innocent explanation
Why the data rule it out
Real forecasting skill
A genuine forecaster is filled at the live price. These entries were filled at prices that had already passed.
Holding losing trades until they recover
That produces large moves against the position while trades are open. These trades went a median $0.96 against, compared with $3.36 for random trades of the same length.
The best of many accounts
A result 22 standard deviations beyond chance over 600 trades would need an impossibly large number of accounts to pick from.
Trade #130 was a glitch
Even setting it aside, the size and timing findings above are unchanged.
The reading that fits all the evidence: a small account earning from a lagging price feed, which works only because the broker allows it, used to market a 24× product at a broker whose payment wallets have taken in over $1 billion of crypto. Under that reading, anything investors are shown beyond what the market really pays has to come from somewhere other than trading.
How likely is each explanation?
98%
That is the combined chance that investors' balances are not backed by profits from trading gold. The chance that this is real trading in the gold market, at the size investors are told, is effectively zero: about 1 in 250,000.
59%
39%
98% · balances not backed by trading profits
≈ 0% Real trading in the gold market at the size claimed
2% The broker keeps the trades on its own books and pays from its own money
59% The broker keeps the trades on its own books and withdrawals are paid from new deposits
39% The size or leverage claims are overstated: far less money is really in it, or amplified balances exist only on screen
What "paid from new deposits" means
Profits are shown on screen but never earned in the market. Withdrawals are paid with money from people who joined later. This is how a Ponzi scheme works. It keeps going while new money arrives faster than money leaves, and fails when it doesn't.
Why 39% is not the safe option
If the balances on screen are bigger than the money, amplified or credited balances exist only on screen. In both cases the balances shown to investors are larger than the money behind them. Anyone withdrawing more than what is really there is paid from somebody else's deposit.
So the two largest explanations lead to the same practical risk: the money shown is not all there. What we cannot tell from trading data is how far that has gone. Only bank and broker records can show it.
How these numbers were made: all four explanations started at equal odds, 25% each. We then judged how likely each piece of evidence would be under each one. These are structured judgments, not measurements, so read the order, not the decimals. We re-ran the calculation 200,000 times with every judgment varied. Real market trading came last in all but one of the 200,000 runs and never rose above 0.4%. The combined 98% stayed between 88% and 99.8% in nine runs out of ten. Separately, the ranges were: house money 0.2–12%, new deposits 14–91%, overstated claims 7–83%.
What the record means for an account
These figures apply the account's actual trade-by-trade results to a deposit. They show what investors would see on screen if the record were real, and what it would have done to them at its worst.
Your account
Figures are before the profit share: investors keep 70% of the profit, the network and the broker take 30%. "As shown" means profits taken out each month. "Reinvested" compounds every trade. The record's largest position was 4.1 times the account's balance, which at 24× means a position about 98 times the deposit.
The whole scheme
Starts at $500 million: about half of the $1.14 billion of crypto paid into TAG's payment wallets since October 2024, the share management says is traded with Sonic.
If profits are booked rather than earned, the only real income is interest on the cash held, assumed here at 4% a year. Everything paid out above that has to come from new deposits or the house's own money.
Follow the money
What the blockchain shows
When clients pay in and withdraw in crypto, the money leaves a public trail. TAG Markets' payment wallets have taken in $1.14 billion of crypto since October 2024 and paid out $1.11 billion. $547 million of that runs through three hub wallets on public blockchains that anyone can check, listed below; the rest is on BNB Chain and Bitcoin, measured with a licensed blockchain-analytics tool.
On this page:
$546.6Mreceived by the three hubs since 26 Oct 2024, on public blockchains
97%of it paid out again ($530.6M)
$13.2Mheld in the hubs on 9 Oct 2026, against $1.14 billion paid in
8 daysbetween the hubs going live and the Sonic AI account starting
In plain words
The payment trail is real and large: over a billion dollars in under two years. But almost all of it has flowed straight out again, and at most about $50 million is still held on-chain: about $13 million in the three hubs anyone can check, plus balances in deposit addresses and probable treasury wallets measured with the licensed tool. (Gross inflows and outflows count every round trip, so $1.14 billion in minus $1.11 billion out is not the amount held.) Money that investors still have in their accounts has to be kept somewhere. If not here, TAG Markets can show where.
Month by month: the TRON hub
The TRON hub is the largest of the three. Each month, blue is what came in and red is what went out. The two move together: in every month since March 2025, what went out was between 92% and 108% of what came in.
USDT only, TRON hub only. Source: TronGrid public data, pulled 9 October 2026; complete months to 30 September 2026.Show the table
Month
In $M
Out $M
Out ÷ in
Deposits
2024-10
0.0
0.0
0.37
56
2024-11
0.2
0.2
0.96
405
2024-12
0.1
0.1
1.32
405
2025-01
0.2
0.2
0.77
514
2025-02
0.8
0.6
0.72
1,038
2025-03
1.0
1.0
0.98
1,521
2025-04
1.4
1.4
1.07
1,853
2025-05
2.4
2.3
0.99
2,675
2025-06
2.1
2.2
1.05
2,395
2025-07
1.6
1.6
1.02
1,373
2025-08
1.3
1.3
0.95
853
2025-09
1.5
1.1
0.75
946
2025-10
5.6
5.5
0.99
7,454
2025-11
3.2
3.7
1.16
3,541
2025-12
6.0
5.9
0.98
4,717
2026-01
6.7
6.4
0.96
6,629
2026-02
7.6
7.3
0.96
6,699
2026-03
9.6
9.3
0.97
8,463
2026-04
21.4
21.7
1.01
13,346
2026-05
26.3
25.0
0.95
15,059
2026-06
30.5
28.8
0.94
13,562
2026-07
35.0
37.6
1.07
12,500
2026-08
49.4
47.7
0.97
13,769
2026-09
64.9
59.6
0.92
17,357
What this shows
✓A large, automated payment operation: hundreds of thousands of deposits and payouts, running every few minutes.
✓Inflows have grown fast: the TRON hub took $149M in July–September 2026, eight times as much as in its whole first year ($13M).
✓Almost everything that comes in goes out again within the same month: about 60% to a very large number of addresses, consistent with client withdrawals, and about 40% on to other TAG wallets and exchanges.
✓Very little is kept: about $13M sits in the hubs today.
What it does not show
–Which deposits were for Sonic AI. The hubs serve all TAG clients.
–Money paid by bank transfer or card, or held at banks or liquidity providers.
–Flows on BNB Chain and Bitcoin. A licensed analytics tool shows roughly another $590M there; we leave it out because you cannot check it for free.
–Any individual's balance.
How it connects to the trading analysis
The size is real. Hundreds of millions of dollars of client money is moving. At that scale, the cost of really trading gold the way the record shows (step 5 of the tests) cannot be avoided.
The money is not kept on-chain. A broker that really trades client money, or takes the other side of client trades, still has to hold the clients' money somewhere. On-chain, almost none of it is held, and none of the identifiable onward destinations is a gold or currency liquidity provider. If the money is in banks, that can be shown.
Inflows are accelerating, and nothing builds up. Monthly inflows have risen almost every month while the hub's balance stays small. A scheme that pays withdrawals from new deposits looks exactly like this while inflows grow; so does a payment hub that forwards money elsewhere. What tells them apart is where the forwarded money ends up, which only TAG's bank and liquidity-provider records can show. This is the run risk described under "How it could end".
The last two months: the TRON hub took $49M in August 2026 and $65M in September. It carries about a quarter of all TAG's crypto inflows, which puts the total near $190M and $250M. That is an estimate from the TRON wallet's pattern, not a measurement.
How long can it last
Over $1 billion came in. What should be there, and what is?
The payment wallets took in $1.14 billion of crypto and paid out $1.11 billion. We do not know how much of what went out was paid back to clients, so we work through three readings, from "investors took almost everything back" to "investors mostly stayed invested", as an investment product intends. Crypto only, all TAG products; balances to 30 September 2026.
A: all outflows went back to clients
B: 60% went back to clients
C: investors mostly stayed in (10% went back)
Paid back to clients
$1.11B
$0.67B
$0.12B
Went to someone other than clients
$0
$0.45B
$1.0B
Clients should hold now
$0.04B
$0.47B
$1.0B
Held on-chain
$0.05B
$0.05B
$0.05B
Missing from the wallets
none
$0.42B
$0.95B
In plain words
Either investors took back almost everything they put in (reading A), so very little money was ever really invested, or hundreds of millions of dollars that should back investors' balances are no longer in the wallets that collected them (B and C). If investors mostly stayed invested, about $950 million has to be somewhere else: in banks or with trading partners, which TAG can prove, or spent.
Money paid in by card and bank transfer
TAG also takes deposits by card, bank transfer (SEPA and SWIFT), Apple Pay, Google Pay and CashApp. Its help centre says it pays out only in crypto: "We currently only facilitate payouts via crypto" (TAG help centre; deposit methods). So every withdrawal, however the money came in, leaves through the crypto wallets. The $1.11 billion paid out is the most that all clients together can have got back. Every dollar paid in by card or bank adds to the money in, never to the money returned.
How much came in by card and bank is not public. Other brokers give a range: Eightcap, an Australian-regulated broker, says crypto is 10–20% of its deposits worldwide and up to 40% in some markets (December 2025); industry data cited by Finance Magnates puts stablecoins above 60% in some markets (January 2026). TAG is likely at the high end, because it pays out only in crypto and grows through crypto-friendly community networks.
If crypto was this share of all deposits
Total paid in
By card or bank
Paid in and never paid back, at least
100% (card payments converted to crypto first)
$1.14B
$0
$0.03B
80%
$1.42B
$0.28B
$0.31B
60%
$1.90B
$0.76B
$0.78B
40% (Eightcap, high end)
$2.85B
$1.71B
$1.73B
20% (Eightcap, worldwide)
$5.69B
$4.55B
$4.58B
In plain words
Money can come in by card or bank, but it can only leave as crypto, and the crypto exits are public. Whatever came in by card or bank and has not left is still owed to someone. If nothing is missing, it must be sitting in TAG's bank accounts or with its payment providers: about $0.7 billion if crypto was 60% of deposits, more if it was less. Those accounts are exactly what a regulator can ask to see.
"At least" treats every crypto payment out as a client withdrawal, which favours TAG: part of it went to TAG's own wallets and exchanges, so the true figure is higher, and profits credited to balances come on top. If part of the $1.14 billion paid in was TAG buying crypto with bank money to fund withdrawals, the card and bank totals above are too high, but the ceiling on what clients got back stays the same. TAG's help-centre pages are dated August 2024.
How fast the gap grows
If investors mostly stayed invested (reading C), the amount owed rises each month by new deposits, minus withdrawals, plus the profit credited. The wallets keep almost nothing, so the gap grows by about the same amount.
Reading C. Monthly figures for all chains are estimated from the TRON wallet's pattern.
The 24× snowball
Why reinvesting makes the problem bigger, not smaller
The Sonic record itself makes about 1.1% a month (between 0.5% and 1.8% in every month so far). Copied without leverage, $1,000 would have grown to about $1,300 over the record's 23 months, or about $1,200 after the 30% profit share. That is not what is sold. What is sold is the strategy at 24×: $1,000 trades as if it were $24,000, so every month's result is multiplied by 24 (the standard is 12×; more than 90% of accounts are said to have 24×). That is about 27% a month on average, between 13% and 43%. The investor keeps 70% of that, about 19% a month; the other 30% goes to the network as commissions (20%) and to the "strategy owner", the broker (10%). Most investors do not take their share out. They reinvest, so next month's 24× result is paid on a bigger balance. And the 30% does not disappear either: commissions are withdrawn or reinvested too, so every dollar of it is also owed or paid out.
$1,200$1,000 following the record for 23 months, no leverage, after the 30% share
$56,000$1,000 at 24×, the investor's 70% reinvested every month. In total the scheme books $257,000 of value on that $1,000, counting the network's and the broker's 30%.
Uses the record's actual result for each month, and your 70% share of it.
Balance on your screen
–
Profit taken out
–
Average credited per month
–
Owed to you for every $1 you paid in
–
In plain words
Every dollar on that screen is a promise. At 24× the profits cannot be coming from the market: trade #130 alone would have wiped the account out, and trading costs overtake the profit from about $30 million. So reinvesting does not grow anyone's money. It grows what is owed: about 19% more every month on investors' own balances, and about 27% counting the commissions and fees booked on top. Because nobody takes the money out, nothing looks wrong, until enough people ask for it at once.
High results to start, lower ones once the money is in
The record's monthly result at 24× has not been steady. It was highest in May–September 2025, between 28% and 43% a month. Since October 2025, as deposits into TAG's wallets multiplied, it has averaged about 23%, against about 32% before: down by more than a quarter.
The record's monthly result × 24, before the 30% profit share. Grey: November 2024 – September 2025. Red: from October 2025, when deposits into TAG's wallets jumped. Dashed: averages.
A real strategy does not care how many people copy it. The public account traded a fixed 0.1 lot from October 2025 to early October 2026 (since 7 October 2026, 6 of its 11 trades have been 0.2 lots, double the size, on an unchanged balance). Its percentage result should not change because more investors joined.
A scheme does care. High early results bring people in. Once the balances owed are large, every point of monthly result costs millions. Lowering it slowly is the "slow fade" described under How it could end.
On its own this does not prove anything: gold markets change, and results can drift. But it is the pattern a managed record would show, and if it continues, results will keep drifting down while the explanation will be that the strategy "manages too much money".
The whole scheme
The same arithmetic applied to the crypto that actually came in (estimated month by month from the wallets), assuming 60% of what left the wallets went back to clients and the rest stayed in and was credited each month with the record's result:
Balances credited at
Owed to investors at 30 Sep 2026
Profit credited in September 2026
New crypto paid in, September
Held on-chain
1× (the record)
$0.24B
$3M
about $125M
$0.05B
24×, investors keep 70%
$0.55B
about $130M booked (about $90M to investors, $40M commissions and fees)
about $125M
$0.05B
24×, everything booked stays in
$0.95B
about $240M
about $125M
$0.05B
At 24×, the profit booked in September alone (about $130–240 million, counting investors' 70% and the 30% for the network and the broker) was as much as, or up to twice, all the new crypto that came in that month (about $125 million, the Sonic half of $250 million). One month's booked profit used up every new dollar, before anyone withdraws a cent.
If new money stopped today and people kept reinvesting, what is owed would double about every three to four months: roughly $1.5–4 billion in six months and $4.5–17 billion in a year, on the Sonic half alone. Nothing in the wallets grows with it.
If investors reinvest more than assumed (10% of outflows back to clients), the amount owed today is about $4.0 billion.
Card and bank deposits are not included; they would make every figure larger. If the product credits less than the full 24×, the figures shrink in proportion, but the doubling does not stop.
Based on the record's monthly results (Myfxbook, November 2024 – September 2026) multiplied by 24, as the product is described. This models the hypothesis that credited profits are not earned in the market; it does not prove it. TAG can disprove it by showing where the money behind these balances is held.
The next months: try the scenarios
This applies the pattern of the last six months: clients withdraw about 3% of their balance a month, balances are credited the strategy's 1.1% a month, and most of each new deposit leaves to people other than clients. Pick how inflows behave next. The amount owed is what investors' screens would show.
86% is the last six months under reading C. Lower it to see how long the operator could stretch things by paying out less.
Cash runs out in
–
Owed after 6 months
–
Owed after 12 months
–
New money in month 12
–
New money over 12 months
–
Line: cash left to pay with (starts at about $50M on-chain). Below zero, withdrawals can only be paid by bringing money back from wherever it went, or not at all.
What this means
It keeps paying only while new money keeps speeding up
Accelerating keeps paying only if new money reaches about $1 billion a month by March 2027 and $3.6 billion a month by September 2027, about $17 billion in a year. Growth like that stops. The question is when.
With today's pattern inflows must grow about 20% every month just to keep paying. If they flatten, the cash runs out in about five months; if they fall, about four; after a shock, about two.
The amount owed keeps growing in every path except a shock: about $2.3 billion within six months even if inflows stay flat. The later it stops, the bigger the hole.
"24×" credits every $1 billion of balances with about $270 million a month. Within a year that is about $18 billion owed, before any new deposit. No inflow can pay that.
This models the hypothesis (trades kept in-house, withdrawals paid from new deposits); it does not prove it. Crypto only: card and bank payments, and any money proven to sit in banks or with trading partners, are not included and would change the result. The full model, with every assumption editable, is in the scenario workbook below.
The Ethereum and TRON hubs were set up 85 seconds apart on the evening of 26 October 2024. How we attribute them to TAG Markets so far: they were created eight days before the Sonic AI account started, and each receives sweeps from very large numbers of one-per-client deposit addresses and pays out every few minutes, the standard set-up of a broker's payment system. Direct proof, a TAG client's deposit swept into a hub and a withdrawal paid from it with transaction hashes, is still being documented. If you are a TAG client, you can test it yourself (step 4 below).
Check it yourself
Open the TRON hub on Tronscan (link above). Check "Created on 2024-10-26", the number of transactions and the USDT balance.
Click Transfers, choose USDT, pick a month and press Download CSV. Add up incoming and outgoing amounts and compare them with the table.
Open the Ethereum and Polygon hubs on Blockscout, tab Token transfers. Ignore unfamiliar tokens: busy wallets receive spam tokens with fake names and values.
If you are a TAG client: deposit a small amount of USDT and note the transaction. An hour later, look up your deposit address: the money should have been forwarded to the hub.
Withdraw a small amount and look up who paid you. The sender should be the hub or a wallet funded by it.
Prompt for an AI assistant
I have exported the USDT transfers of the TRON address TUEDTpgFNfkP51q1463HzfrLvtf1a1ULj7 from Tronscan as CSV (attached). 1) For each calendar month (UTC), sum the USDT received by this address and the USDT it sent, and count the distinct senders. 2) List the 20 counterparties that sent or received the most. 3) Compare my monthly totals with this table: [paste the site's table]. Show your working and flag any month that differs by more than 2%.
Download
Wallet evidence pack
The hub addresses, flows by chain, the TRON month-by-month table, our spot-checks against the explorers, a step-by-step guide and the limits of the data. Only TAG's own operational wallets are included: no client or third-party addresses.
Excel workbooks (evidence and scenario model), PDF guide and CSV files.
How 24× is sold
The product is not the strategy. It is the multiplier.
On its own, the Sonic record makes about 1.1% a month. What is promoted to investors is a deposit "multiplied" by 12 or by 24. Below are the promoters' own posts, with dates, and the money arriving in TAG's wallets.
1
The standard offer: deposits multiplied by 12
According to people inside the network, the normal product multiplies a deposit by 12. More than 90% of accounts are said to have 24× (see who gets 24×, below).
2
October 2025: deposits into TAG's wallets jump
Deposits into TAG's TRON payment hub jump from 946 in September to 7,454 in October, nearly eight times more, and the amount from $1.45 million to $5.62 million. The average deposit halves, from about $1,540 to about $750: many new, small deposits.
3
17 December 2025: "last chance to unlock X24 power"
A post in the XFusion community's public Telegram channel: "Last chance to unlock X24 power", deadline 31 December 2025, showing a "24x funded account" of $24,000 next to the investor's own $1,000, and promising that anyone who activates X24 now "keeps it permanently". The same day, an "X24 webinar" is announced for German-speaking business partners. December deposits into the TRON hub: 4,717, worth $6.0 million.
4
2026: the volume keeps climbing
Leaders are celebrated by volume rank, for example a "LEGEND" rank for "$20,000,000 volume achieved". A message introduced as from TAG Markets' founder is shared "with your teams and partners". Monthly deposits into the TRON hub reach $64.9 million in September 2026, from 17,357 deposits.
The posts themselves
Tap to enlarge. The "last chance" image itself shows the pitch: a $1,000 account earning 2% ($20), next to a $24,000 "funded account" earning 2% ($480).
Who gets 24×
12× is the standard. Most investors get 24×, and how they get it makes it worse.
The standard product multiplies a deposit by 12. According to people inside the network, more than 90% of accounts have 24×. There are three ways in:
1. A worthless token, "burned"
Communities that were moved into TAG, or into its white-label introducing-broker (IB) portals, often came with their own crypto token that had already crashed and was close to worthless. TAG takes these tokens and "burns" them. In exchange, their holders get 24× instead of 12×.
2. Time-limited promotions
For example the "last chance to unlock X24 power" campaign of December 2025, with the promise that 24× is kept "permanently".
3. Ongoing offers in some communities
Inside some white-label IB portal communities, 24× is offered on an ongoing basis, with no token needed.
Why the token swap makes it worse
A token that has crashed is worth close to nothing. In exchange for it, holders get profits credited on 23 extra dollars for every dollar they deposit. A real broker would be taking on enormous risk in return for nothing. It only makes sense if those profits are never meant to come from the market: they are promises, paid out of other people's deposits.
And 12× does not save it
For the few accounts at 12×: trade #130 would still have taken about 119% of the account. On $500 million, each trade would be about 14 tonnes of gold, around seven times what the world trades in a minute, and trading costs would turn the record's profit into a loss of about $3 billion.
Source for the token conversion and the share of 24× accounts: members of the network. We have not seen the terms in writing. If you have them, please send them.
Sold in the same channel
A crypto wallet and debit card, registered through the same IB portal
In 2026 the XFusion community channel, the same public channel that posts the Sonic trades and the "X24" promotions, began promoting BIX: a crypto wallet, "BIX Pay", and a Visa debit card. The network's own step-by-step guide shows how it is set up, and it is set up through the investor portal.
1. Registered through the IB portal
The "BIX Guide" tells members to log in to the XFusion IB portal, open Profile › Products › BIX Register, and connect the BIX app by scanning a QR code from the portal. The app then shows "IBPortal wants to access your account", asking to read wallets and balances, transactions, the profile, and cards and card transactions.
2. Money straight from the portal to the card
"Direct Money Movement: IB-Portal → BIX-Wallet → Directly to the Debit Card! No need to use external wallets." The same channel's guide list puts "BIX.FI INFO" and "BIT1 INFO" next to "Top up active Strategy Balance on Copy X in Tag Markets" and the "Reinvest Guide".
3. Cards up to $25,000, and a compensation plan
Cards cost $9.99 (virtual), $100 (plastic), $250 (metal) or $25,000 (gold), and "All cards have identical functions", plus an optional $9.99 a month. Coming "in ca. 2 months": a SEPA IBAN, SWIFT transfers and bank on- and off-ramps. And: "The compensation plan includes up to 60%".
Why it matters
It is a payment rail for the scheme's money. A direct route from the IB portal to a wallet, a card and, soon, bank accounts is a way for money to enter and leave the system. Whoever runs that route will face the same questions about where the money came from.
It is a door into whole communities. People inside the network report that the card is offered to companies and communities first; their owners and leaders are then offered money to bring members across and promote TAG.
It is a second recruitment product. A $25,000 gold card that, by the guide's own words, works exactly like the $9.99 one, sold alongside a compensation plan of up to 60%, earns the network money from selling cards, on top of the investment itself.
If TAG falls, the card falls with it. When a scheme collapses, investigators and liquidators trace every route the money took, and banks, card networks and payment partners usually cut ties with anything linked to it, often before any court decides. A card programme built into the same portal and promoted by the same leaders is exposed by default: cards can be blocked and balances held while that happens, and leaders paid to promote it can face claims to give back what they earned.
The portal can see members' money. The access the guide asks members to approve lets the IB portal read their BIX wallets, transactions and card spending.
Who stands behind it is not stated. BIX describes itself as a self-custody wallet with a Visa card programme. Its press release says card issuing is done by "third-party institutions under their own arrangements"; we found no public statement naming the issuing bank or its licence. The App Store lists the developer as "Bit One Ventures".
Before you use it
Ask which bank issues the card, in which country, under which licence, and check that licence on the regulator's register yourself.
Do not buy a card, least of all a $25,000 one, to join or to move up a rank.
If you use it to take money out, move it on to a wallet or bank account you alone control. If the wallet is self-custody, check that you can export the private key before you rely on it.
Think twice before approving portal access to your wallets and card transactions.
We are not saying BIX or any company behind it is part of a scheme. These are the questions anyone should ask before money moves through it.
The posts and the guide
Screenshots from the public Telegram channel "XFUSION OFFICIAL | COMMUNITY CHANNEL" and from the "BIX Guide" PDF shared with the community, captured 18 October 2026.
What a "multiplied deposit" means
$1,000 in, $24,000 on screen. Whose is the other $23,000?
If it were real money in the market
Someone has to provide the extra $23,000 for every $1,000. On the roughly $500 million management says is traded with Sonic, that is about $11 billion (23 × $500 million, a little less for the few accounts at 12×) that the broker would have to put up from its own capital. That is many times what even the largest listed retail brokers hold, and it would have to be at risk on every trade.
If it is only a number on screen
Then the profit on the extra $23,000 is not earned anywhere. When an investor withdraws it, it has to be paid from somewhere: the broker's own money, or other investors' deposits. At this size, only the second is possible. That is how a Ponzi scheme works.
"Keeps it permanently" matters too: the multiplier never runs out, so every month's result is multiplied by 24, month after month, and reinvested balances compound. That is the snowball.
The same trades, about 500 times bigger
13 trades posted in July 2026 are the Sonic record, multiplied
The public Telegram channel XFUSION OFFICIAL, which promotes the product, posted these trade screenshots between 14 and 29 July 2026, each captioned "Sonic.ai TP". Each one matches a trade in the Myfxbook record: same side, opened within a second of the record wherever the screenshot shows the time, and in 12 of 13 cases the same entry price to the cent. Each is about 501 times the record's size: about 50 lots, roughly 5,000 ounces or $20 million of gold per trade, with about $500 of commission each.
Record
Opened (broker time)
Side
Entry, record
Entry, posted
Exit, record
Exit, posted
Posted exit worse by $/oz
Size vs record
Posted profit $
#543
14 Jul 07:51
Sell
4017.70
4017.70
4019.00
4019.29
0.29
502×
-7,978
#544
14 Jul 08:30
Buy
4024.24
4024.24
4031.77
4031.42
0.35
501×
36,003
#545
15 Jul 08:31
Buy
4025.35
4025.35
4032.71
4032.65
0.06
501×
36,604
#546
15 Jul 15:13
Buy
4036.97
4036.97
4038.78
4038.43
0.35
502×
7,324
#550
20 Jul 17:51
Sell
4010.12
4010.12
4005.87
4006.31
0.44
502×
19,110
#551
21 Jul 09:41
Buy
4075.28
4075.28
4080.48
4080.12
0.36
502×
24,274
#552
21 Jul 19:41
Sell
4074.95
4074.65
4071.85
4072.23
0.38
502×
12,139
#553
22 Jul 07:00
Sell
4130.33
4130.33
4127.78
4128.13
0.35
502×
11,036
#554
22 Jul 22:54
Buy
4129.52
4129.52
4130.90
4130.76
0.14
502×
6,221
#557
24 Jul 08:50
Sell
4028.48
4028.48
4023.75
4024.09
0.34
502×
22,018
#560
27 Jul 16:33
Buy
4078.44
4078.44
4088.15
4087.83
0.32
501×
47,077
#561
28 Jul 07:47
Sell
4046.03
4046.03
4041.51
4041.86
0.35
502×
20,915
#562
29 Jul 07:20
Buy
4022.45
4022.45
4025.68
4025.40
0.28
502×
14,797
The screenshots as posted
Each labelled with the record trade it matches. Cropped to the post; ticket numbers blurred, nothing else changed. Tap to enlarge.
Same signals
Matching 13 trades to the second and the cent, one after another, cannot happen by chance. What is promoted as Sonic is the Sonic record, scaled up.
Every exit worse
All 13 posted exits are worse than the record's, by $0.06–$0.44 an ounce (about $0.31 on average). If it were random, that would happen about once in 8,000 tries. It is what copying a master account, with a delay, looks like.
$20 million a trade
One copying account alone places about $20 million of gold per trade. Multiply that by everyone at 24× and the totals reach the sizes tested under Six tests, where trading costs overtake the recorded profit.
In plain words
Investors are not sold a 1%-a-month gold strategy. They are sold a deposit multiplied by 24, through a recruitment network that rewards volume, with the broker's founder presented as endorsing it. The multiplier is what brought the money in, and it is what cannot be real.
Quotes are from posts in public Telegram channels promoting the product, dated as posted. We do not name or show individuals, and account numbers are left out. Times are the broker's server time. Posts like these can be deleted at any time: why that matters, and how to keep copies.
Promoter communities
Who sells it, and what they promise
Sonic AI reaches investors through communities that recruit for TAG Markets. This page documents those communities by brand: their public channels, the material they show to prospects, and how their promises compare with the public record.
How this page works: we only use material a community publishes or shows to prospective members. Every file is kept with a SHA-256 fingerprint. We leave out the names and faces of private individuals. A community that thinks something here is wrong can ask for a correction, and we will publish its reply (contact).
Community 1
XFusion
XFusion ("Energy. Knowledge. Capital.") is, as far as we can see, currently the main community promoting Sonic AI. Its presentation sells three products as one package: the broker TAG Markets, the crypto exchange Bit1 and the BIX crypto debit card ("Benefit from all 3 systems"). It promotes two TAG strategies, Sonic AI (gold) and NEO.FX (euro-dollar), and pays members for recruiting.
Public channels
Telegram: XFUSION OFFICIAL | COMMUNITY CHANNEL (5,265 subscribers in December 2025). Its posts are on How 24× is sold.
Website: xfusion.community, as given in the channel.
Presentation: "XFusion (ENGLISH)", 46 slides, shared with prospects as a Canva link. Captured 28 October 2026; all slides are below.
We will add other public channels as we document them.
Their words against the record
What the XFusion presentation says, slide by slide, and what the public evidence shows. Tap a slide number to see the slide.
The presentation says
What the record shows
"Security: Every trade includes Take Profit (TP) & Stop Loss (SL)." (Sonic AI, ; the same claim for NEO.FX, )
In the account's public Myfxbook history, the stop-loss and take-profit columns are empty ("-") on every trade in our archived pages. The Sonic trade screenshots that XFusion itself posted in July 2026 also show "S/L: –" and "T/P: –".
Trade #130 was about $12,890 under water, about 10% of the account, before it was "closed" on a Saturday for a $4 loss. The published 0.86% leaves it out. By the deck's own −5% rule the account would have been closed; at 24× that trade is a loss of about 240% of the money (six tests).
"Where does the money come from? ALL profit ONLY when real market gains are achieved" ()
The same presentation pays its biggest rewards on new money, not on trading results: a bonus of up to 7.5% on "monthly volume (new deposits)" (), a Rolex for $500,000 of volume (), a house worth up to $1.2 million for $3 million of sales a month () and a Dubai trip for "new team volume" ().
"Insolvency insurance in the amount of $1.000.000 … The maximum insured amount per client/case is up to $1.000.000." ()
The certificate on the same slide gives a limit of USD 1,000,000 "(Shared Aggregate with another group entity)": one limit shared across the group, not $1 million for each client. TAG's payment wallets have taken in about $1.14 billion (follow the money).
"Your 24X amplify trading boost. Same strategy, small risk. More capital, higher results." ()
24 times the position is 24 times the risk, not "small risk". At the size of the money said to be in Sonic, each trade would be many times the gold the world trades in a minute (six tests).
NEO.FX: 19,064 followers and "AUM $19,523,250.81" ()
The NEO.FX track record the presentation shows () is a Myfxbook account with $12,000 deposited and $656 of profit, about eight months old. We have not yet tested NEO.FX ourselves.
"No hidden fees. 100% transparent." ()
The same presentation shows a 30% performance fee (), of which 25 points go to affiliates and 5 to the trader ().
How their own plan pays
From the presentation ():
Recruit to unlock levels
A $250 account unlocks 3 levels. All 10 levels need "10 direct referral partners with $250 each".
Paid on new deposits
The "Infinity Bonus" pays 1.5% to 7.5% of the team's "monthly volume (new deposits)", from $10,000 up to $40 million a month.
Paid on profits, 10 levels deep
25% of the profit credited to investors goes to affiliates, plus a commission on every lot traded, over 10 levels.
Leader pools
"1% of all profits from NEO.FX + SONIC.AI flows into each pool", shared by leaders with $500,000 or $1 million of team revenue.
The same plan continues into the other two products: up to 60% of Bit1 trading fees, on futures with 50× to 100× leverage (), and 50% of BIX card fees and card sales, over 10 levels (). The BIX cards cost from $9.99 to $25,000, and "all cards have identical functions" (). Bank transfers in and out of the card (SEPA and SWIFT) are announced as coming ().
In plain words
The presentation says profits come only from the market. Its own pay plan rewards bringing in new deposits, with cash, watches, a house and trips. When rewards depend on new money, the people at the top are paid whether or not the trading is real.
Claims to check
The presentation quotes two licences for TAG Markets' companies (, ):
T.M. Financials Ltd, Mauritius: "Investment Dealer: GB21026474", licensed 28 March 2024 by the Financial Services Commission (FSC).
TM Financials SA (Pty) Ltd, South Africa: financial services provider FSP 55237, authorised by the FSCA on 28 October 2025.
We have not yet checked these against the regulators' public registers. Anyone can: search the FSC Mauritius register and the FSCA's FSP search for these numbers, and check what each licence actually covers. A licence says a company may do certain business; it says nothing about whether the trades shown to investors are real.
The presentation
44 of the 46 slides. Slides 39 and 40 ("Hall of Rolex") show the names and faces of private individuals, so they are not published; they are kept for regulators, journalists and lawyers. Each image is the slide only, with no other data.
Download
XFusion presentation
The 44 published slides with a SHA-256 fingerprint for each file.
Quotes are copied from the presentation as written, including its spelling and number format. More communities will be added as we document them.
What they might say, and what the evidence says
People behind the strategy or the broker may answer these findings. Here are the replies we expect, what the evidence says about each, and the record that would settle it. If any reply comes with that record, we will publish it next to the finding.
Ask them to say it in public
Ask TAG's founder and management to answer this site on a public, recorded call
In offices and private meetings, investors are told that Sonic is real trading in the real gold market, that the 24× is real, and that the other 23 dollars for every dollar come from liquidity providers. Ask the people saying it to say it on the record: a public Zoom or livestream, recorded, open to questions.
Statements to ask them to make, word for word
"Every Sonic trade is executed in the real gold market with outside liquidity providers."
"Investors' money is traded at 24×, and the other 23× is provided by our liquidity providers, who carry the risk."
"The total client money in Sonic is $___, and we will show the liquidity providers' confirmations."
"Every investor can withdraw their full balance, at any time, without conditions."
Questions to put to them
Each of the six tests: win rate, Sharpe ratio, timing, trade #130, size, leverage.
How a position was closed on a Saturday, when gold does not trade.
How each trade can be bigger than all the gold the world trades in a minute.
Where the money is: the wallets that collected $1.14 billion hold at most about $50 million.
Which bank holds client money, and which licence covers clients in the UAE.
If they agree, we will publish their answers in full, next to this analysis, and correct anything they show to be wrong. If they refuse, or find reasons not to, ask yourself why. Anyone with a real strategy, real liquidity providers and real money in the market has every reason to say so in public. Statements made publicly to investors carry legal responsibility: that is exactly why the answer matters.
How to ask: send the request in writing to your leader and to TAG Markets' support, keep a copy, and note the date and the reply. Ask others in your community to send the same request.
Shown in a meeting
Screens shown in a room are not evidence
At a private presentation, people from the network's management showed investors three things on a screen. Phones were not allowed, so nobody could photograph or check what was shown. (This comes from people who attended. We have not seen the screens ourselves.) None of the three answers a single one of the six tests.
1. A list of liquidity providers
A list of company names proves nothing. It does not show that any of them filled a single Sonic trade, or that any of them put up the other $23 for every $1 investors deposit. Showing the list makes it worse, not better: if those companies really did this, getting it confirmed in writing would be easy, and nothing like that has been shown.
2. A bank account with money in it
A balance shows money on one day. It does not show whose money it is, what is owed against it, or where it came from. Investor deposits look exactly the same on a bank statement. It also changes nothing in the six tests, which are about the trading record itself: trade #130, the timing, the size and the rest are the same whatever sits in a bank account.
3. A MetaTrader account
Every Sonic investor already sees MetaTrader every day, so this shows nothing new. MetaTrader shows whatever the broker's own server records. The broker runs that server, so a screen can show trades and balances that never reached the market. Fraudulent brokers have used exactly this to show investors whatever kept them on board.
What would actually count
From each liquidity provider: a signed letter, on its own letterhead and checkable directly with the company, confirming that it filled the trades of this strategy. Trade-by-trade confirmations whose times and prices match the 637 trades in the public record.
For the other $23 per $1: written confirmation of who provides that money, and how much, against the total balances shown to investors.
For the money: an independent audit comparing what is held with everything owed to all investors, not one balance shown on a screen.
For the record: an answer to each of the six tests, with data anyone can check.
Ask for documents you can keep and check, not screens you are not allowed to photograph. A legitimate business can hand them over. If it will only show them in a room with no phones, that is an answer in itself.
The 24× product
“24× is just leverage. Every CFD broker offers it.”
The evidenceReal leverage makes your positions 24 times bigger in the market, so losses are 24 times bigger too. Trade #130 was down about 10% of the account before it was closed; at 24× that is a loss of about 240% of the money. Every 24× account would have been wiped out or margin-called. Instead, 24× balances only ever went up.
What would settle it24× account statements for June–September 2025 showing trade #130, its floating loss and any margin call.
“24× accounts run a different, safer version of the strategy.”
The evidenceThen the public Myfxbook record says nothing about 24× results, and the trading behind the product investors actually buy has never been published.
What would settle itThe full, verified trading history of the 24× accounts.
“Losses are covered by insurance or a protection fund.”
The evidenceInsurance does not cover trading losses. Policies cover specific events such as theft, hacking or fraud by staff. Losing money on trades is the risk you accept when you invest, and no insurer covers a strategy's losses, let alone at 24×. A "black swan" market move that wipes out the accounts would not be insured. And if the trades were never in the market, the money was not lost there: a sudden "market event" is a common way schemes explain why balances are gone, while the money paid in sits wherever it was moved. A "protection fund" would have to hold real money; the wallets that collected $1.14 billion hold about $50 million.
What would settle itThe policy, the licensed insurer and the exact events it covers, confirmed by the insurer; for a fund, proof of the money it holds.
“The 24× is a bonus or credit, not real leverage.”
The evidenceThis answer makes the problem worse, not better. If the 24× is a credit or bonus, then 23 of every 24 dollars "trading" are not real money in the market. The profit credited on them is not earned anywhere: it is simply written onto investors' balances by the broker. At 24×, that came to about $130–240 million in September 2026 alone, counting the commissions and the broker's fee booked on it, as much as or up to twice all the new crypto paid in that month, against at most about $50 million held in the wallets. No broker can pay that from its own capital. The only money available to pay those profits when people withdraw is money deposited by other investors. That is how a Ponzi scheme works.
What would settle itThe written terms of the 24× product, who funds the profits on the credited part, and bank and wallet records showing that money is held, not paid from new deposits.
“We hedge the 24× exposure with liquidity providers.”
The evidenceHedging at 24× means putting 24 times the money into the gold market. At that size, trading costs overtake the recorded profit from only about $30 million, and one month of new money makes every trade bigger than what the whole world trades in a minute.
What would settle itConfirmations from the liquidity providers for those hedges, at those times and sizes.
“Most clients withdraw their profits, so there is no big balance building up.”
The evidenceAt about 27% a month, withdrawn profits would leave through the crypto wallets, the only way TAG pays out. The wallets show money going out at roughly the rate new money comes in, and the profit booked in September at 24× was as much as or up to twice all the new crypto that arrived. Either most profits are not withdrawn, or they are paid with other people's deposits.
What would settle itTotal profits credited to 24× accounts each month, next to total withdrawals paid.
“Everyone who asked for a withdrawal has been paid.”
The evidenceThat is how schemes paid from new deposits build trust. Paying the people who ask is easy while new money arrives. The question is whether everyone could be paid at once.
What would settle itProof of reserves: the money held, against the total balances shown to all investors.
“The 24× product is run by a community or introducer, not by TAG.”
The evidenceThe balances are shown on TAG's platform and paid out through TAG's wallets. Whoever books the 24× profits has to show where they come from.
What would settle itWhich company books the 24× profits, and its licence and trading records.
“There are risk warnings. Investors knew returns are not guaranteed.”
The evidenceA risk warning covers losses from real trading. It does not explain where the money comes from if the profits shown were never earned in the market.
What would settle itThe same records as above. A disclaimer is not evidence.
“Returns are lower now because the strategy manages too much money.”
The evidenceIf size limited the strategy, it did so long ago. At 24×, trading costs overtake the recorded profit from only about $30 million; the roughly $500 million said to be in Sonic is more than 15 times that. Cutting results now does not fix anything: the balances built up by two years of 24× compounding are still owed. It only makes the product less attractive, so new money slows and the last people in hold the loss.
What would settle itAudited statements showing what the money was actually invested in, and liquidity-provider confirmations of the trades at that size.
“Withdrawals are paused while we restructure, audit or migrate.”
The evidenceA business that holds its clients' money can pay it back while it reorganises. A pause without a firm date is the most common step before a collapse, and it gives time for money to be moved or put into other bets investors never agreed to.
What would settle itA firm date, the name of the auditor or regulator involved, and proof of the money held while payments are stopped.
“24× is a reward for converting your old tokens.”
The evidenceA token that has already crashed is worth close to nothing. Swapping it for profits credited on 23 extra dollars for every dollar deposited means handing out promises worth far more than what was received. No real broker takes that risk for nothing. It only adds up if the profits are never meant to come from the market.
What would settle itThe written terms of the token conversion, what the burned tokens were worth, and where the money to pay the extra profits comes from.
Trade #130
“It was a glitch or a data error at Myfxbook.”
The evidenceMyfxbook's track-record check confirms the history matches the broker's own records, so the entry came from the broker's server, not from Myfxbook. A random glitch would also be unlikely to reproduce the previous trade's exact prices in reverse and close at its exact opening time, to the second.
What would settle itThe broker's own statement and server log for the trade.
“It was a correction: the broker reversed #129 because it was filled at a wrong price.”
The evidenceA reversal of #129 would cancel its +$903.60 profit. That profit is still on the record; #130 booked −$4. A correction also does not need a position held open for 91 days. And a broker that can open, hold and close client positions at prices of its choosing is keeping those trades on its own books, which is the point this finding makes.
What would settle itThe broker's correction notice and the reason given at the time.
“It was a hedge, closed with the 'close by' function.”
The evidenceClosing two opposite positions against each other happens at one moment, at market prices. It does not explain a position open for 91 days, closed on a Saturday, at a price $280 from the market.
What would settle itThe platform's deal log showing how the position was closed.
“The Saturday date is a time-zone mix-up.”
The evidenceThe close is stamped 16:09 server time on Saturday 20 September 2025, which is 13:09 UTC. Gold stops trading on Friday evening New York time and reopens on Sunday evening. No time-zone shift turns that into a trading hour, and the price is $280 from anything gold traded that week, whatever the time.
What would settle itNone needed; the date and the market hours are public.
“It is one trade out of 637 and doesn't matter.”
The evidenceThe size and timing findings do not depend on it. But a record that can contain one entry no market produced is not a record of market trading, and the same applies to #249.
What would settle itAn explanation of #130 and #249 from the broker.
Win rate and timing
“Our algorithm is simply very good.”
The evidenceA genuine forecaster is filled at the live price. These entries were filled about $0.15 better than the live price at that second, roughly where the price had been 30–60 seconds earlier, and exits show no such gap. Skill does not explain fills at prices that had already passed.
What would settle itOrder and fill logs with millisecond timestamps and the live quote at each order.
“Your price data is wrong, or from a different source than our broker.”
The evidenceWe used two independent sources. Since September 2025, 98–100% of fills match a price that traded in the same minute, so the sources agree with the broker at minute level. The difference is in seconds. Our seconds-level sample is 111 trades, which we state openly.
What would settle itThe broker's own tick data for those trades.
“Better prices are normal: it's positive slippage.”
The evidenceSlippage happens in both directions. Here the advantage appears on entries only, almost every time, and never on exits.
What would settle itThe broker's slippage statistics for all clients, compared with this account.
“We use limit orders, so we get good prices.”
The evidenceA limit order fills only when the market trades at that price. These entries were filled at prices the market had already left, just before it moved further in the trade's favour.
What would settle itThe order type and time of each order.
“Win rates of 85–90% are common for short-term strategies.”
The evidenceThey are common when losses are allowed to run, which produces occasional large losses. Here the average win is about twice the average loss, and random entries with the same targets win 18–36%.
What would settle itNone needed; the targets and results are in the public record.
Size and leverage
“The money is spread across many accounts and brokers, so no single trade is that big.”
The evidenceSplitting the money does not change the total amount of gold bought in the same minute. If the trades are instead spread out over time, they are filled at different prices from this account, so investors' results would not match this record.
What would settle itStatements from the accounts and counterparties that hold the money.
“We trade directly with large banks and liquidity providers.”
The evidenceThe World Gold Council figure already counts every bank and exchange in the world. The problem is the total size of the market, not the choice of counterparty.
What would settle itConfirmations from those banks for trades of this size at these times.
“There isn't really $1 billion in the strategy.”
The evidenceTAG's own payment wallets took in $1.14 billion of crypto from October 2024 to October 2026. Even if only part of it is in this strategy, at 24× trading costs overtake the recorded profit from about $30 million. And the question of who pays the profits shown on investors' screens remains whatever the amount.
What would settle itAudited figures for the money invested in this strategy, and proof of where client money is held.
“The 24× leverage is credit or a bonus from the broker.”
The evidenceThis answer makes the problem worse, not better. If the 24× is a credit or bonus, then 23 of every 24 dollars "trading" are not real money in the market. The profit credited on them is not earned anywhere: it is simply written onto investors' balances by the broker. At 24×, that came to about $130–240 million in September 2026 alone, counting the commissions and the broker's fee booked on it, as much as or up to twice all the new crypto paid in that month, against at most about $50 million held in the wallets. No broker can pay that from its own capital. The only money available to pay those profits when people withdraw is money deposited by other investors. That is how a Ponzi scheme works.
What would settle itThe written terms of the 24× product, who funds the profits on the credited part, and bank and wallet records showing that money is held, not paid from new deposits.
Everything else
“You only looked at the last few months.”
The evidenceEvery test covers the full public history, split into ten periods: all 637 trades from 4 November 2024 to 19 October 2026, and for the tests against market prices, the 626 trades to 5 October. The early phase fails differently from the recent one. Before September 2025, most periods are no better than chance and the record contains impossible trades. After it, fills are at real prices but rely on old quotes. Both phases are shown side by side on the Overview.
What would settle itThe trade list and all 33 history pages are on this site; check any period yourself.
“The account is verified by Myfxbook.”
The evidenceMyfxbook defines that check as the history matching the broker's records. It does not check that trades reached the market. The account was added on 15 June 2026; everything before was loaded in one go.
What would settle itMyfxbook's own help pages.
“People withdraw money without problems.”
The evidenceThat is expected under every explanation on this page, including payouts funded by new deposits. Such schemes pay withdrawals while new money arrives faster than money leaves. Working withdrawals do not tell the explanations apart.
What would settle itBank records showing withdrawals paid from trading profits.
“The broker is regulated.”
The evidenceThe broker operates under a Mauritius framework, and regulators in Austria and Luxembourg have warned that it is not authorised to provide certain services there. Regulation also does not verify a trading record.
What would settle itConfirmation from the regulator of what it supervises.
“Whoever made this site has an agenda.”
The evidenceEverything here can be checked without trusting us: the trade list, every page of the original history, the price sources, and prompts anyone can run with their own AI assistant.
What would settle itRun the checks yourself.
“An AI made this analysis, and AIs make mistakes.”
The evidenceThey do, and so did we: the corrections log lists three. The central facts do not need an AI to check: a Saturday close date, prices $280 from the market, and world gold volume per minute.
What would settle itRun the prompts in the "Check it yourself" section.
Don't trust us. Check.
Anyone can do what we did
This whole site was built by one person working with an AI assistant, using only public information: the Myfxbook record, public gold prices, public blockchains and the promoters' own public posts. The questions were asked neutrally, never telling the AI what to find, and every conclusion rests on numbers you can check.
No special access, no insider and no trading software was needed. You can do the same with any AI assistant that can run code: ask the questions, follow the trails, and see where they lead. Use this site as your starting point, or ignore it and start from scratch.
1. Check our data
Open Myfxbook account 12076857 and compare it with our trade list, the 33 history pages we archived on 8 October and the update page of 20 October. Every row should match.
2. Rerun our tests
Give an AI the trade list and the neutral prompts below, one stage at a time. It runs every test itself, on the raw data.
3. Audit this site
Give an AI everything on this site and ask it to find our mistakes and run tests of its own. Use the audit prompt below.
4. Follow the money
Paste TAG's three hub wallet addresses into a free blockchain explorer and see the deposits and withdrawals for yourself.
We expect that an honest, careful analysis will come to the same conclusions. If yours does not, we want to know: tell us what you found and we will check it and publish the correction.
Audit prompt: have an AI check this site
1. Download the audit pack: one zip with everything the assistant needs (trade list, all 33 history screenshots and the statistics pages, our workbook, the wallet evidence, the promotion posts, a read-me, and both sets of prompts). 2. Attach the whole zip to a chat with an AI assistant that can run code and search the web. 3. Paste this prompt. It works even if the assistant cannot open this site. It gives the facts and the tests, never the answers: the assistant has to find its own market data and benchmarks. If it stops part-way, type "continue".
I am attaching an evidence pack about the "Sonic AI" gold trading strategy (Myfxbook account 12076857, broker TAG Markets). The pack's README lists every file. If any file is missing or will not open, list it, then carry on with the rest. The website the pack comes from may not load for you; you do not need it.

Act as an independent, sceptical reviewer. Do not assume the material is right or wrong; it may contain mistakes, and I want them found. Run code on the data yourself. Use web search for market data, benchmarks and regulator records. Do not take any of our numbers on trust: recompute them.

This is a long task. Work through every part. If you run out of space, say exactly where you stopped and I will type "continue".

THREE QUESTIONS, ANSWERED SEPARATELY
Q1. Is the Myfxbook record a record of real trades, filled in the gold market at the prices and times shown?
Q2. Could the same results be earned at the size and leverage investors are sold (below)?
Q3. Can the money shown to investors exist, given the public wallet data?
Keep these separate. Uncertainty about one is not a reason to leave the others unanswered. For Q1, take every test into account: say how many trades pass and how many fail each check, and whether entries that no market could have produced change how far the rest of the record can be trusted. A fill that lies inside a 1-minute range is not by itself evidence that the market filled it.

WHAT INVESTORS ARE TOLD (statements from inside the investor network; no public documents)
- Investors are shown the record's monthly percentage result multiplied by 24 ("24×"). The standard offer is 12×; more than 90% of accounts are said to have 24×, through promotions, community offers, or in exchange for "burning" crypto tokens that had lost most of their value.
- Investors keep 70% of the profit; about 20% goes to the recruitment network and 10% to the broker.
- Management says about half of the money paid into TAG Markets, roughly $500 million, is traded with Sonic AI.
- Definition to use: for an investor's 24× result to be earned in the market, each position must be 24 times larger, relative to the investor's capital, than the record's own position is relative to its balance. If you think a different reading is more reasonable, show both.

PUBLIC FACTS TO RECHECK
- The record: 637 gold trades from 4 November 2024 to 19 October 2026, $34,908.40 recorded profit, deposits and withdrawals in the CSV. The history screenshots are the 33 pages archived on 8 October 2026 (the 626 trades to 5 October); the 11 trades from 6 to 19 October are on the update page captured 20 October (update-2026-10-20.png). From 7 October 2026 some trades are 0.20 lots instead of 0.10; treat this as a new period in test 4.
- TAG Markets' crypto payment wallets: about $1.14 billion paid in since October 2024 and $1.11 billion paid out (gross; round trips count each time). Of that, $547 million in and $531 million out ran through three hub wallets on public blockchains that anyone can check (addresses in the pack); the remaining $591 million (BNB Chain and Bitcoin) was measured with a licensed blockchain-analytics tool and cannot be checked with free tools. About $13 million is held in the three hubs (checkable). The licensed tool puts total on-chain holdings at no more than about $50 million and total outflows at $1.11 billion; neither can be checked with free tools. Gross in minus gross out is not the amount held, because flows include transfers to TAG's own treasury wallets and to exchanges.
- In July 2026, a public Telegram channel of the investor network posted 13 "Sonic" trades that match trades in the record at about 501 times their size (screenshots and match table in the pack).

RULES
- For every test, give a verdict: CONSISTENT with real market trading, INCONSISTENT, or CANNOT TELL. If a test could not be run because of your tools (no code, no internet, a file would not open), mark it NOT RUN rather than CANNOT TELL, and say what you would need.
- Name every market-data source, the dates it covers and how many of the 637 trades it covers. Do not use a source whose origin you cannot state. If you cannot download data, say so and list exactly what to attach (instrument, dates, UTC hours, 1-minute or tick).
- Answer CANNOT TELL only if you name the record that would settle it (for example liquidity-provider fill confirmations, broker order logs), say whether a genuine broker could produce it easily, and say whether it has been produced.
- Use data at the right resolution. A question about seconds needs tick or second data. A price that traded somewhere in a minute can still be a stale price at the second the trade was recorded. If you only have minute data for a seconds-level question, answer CANNOT TELL for that part; do not turn it into CONSISTENT.
- Missing records do not cancel tests you can run with public data.
- Give numbers, not adjectives: sample sizes, standard deviations, p-values, and the assumptions behind any model.

TESTS

1. Data and ledger. Match the trade list against the history screenshots (all 637 if you can, at least 20 spread across the history). Reconcile deposits, withdrawals and profit with the account balance shown in the statistics screenshots, and explain any gap. List every trade whose recorded profit does not match its price move, lot size and costs. List anything unusual in the cash movements and timestamps (weekends, the daily market break).

2. Broker clock and prices. Work out the broker server's time offset from UTC by testing offsets against independent minute data (for example Dukascopy or HistData XAUUSD), allowing for the weeks when US and European clocks change on different dates. Then check that every fill price lies within what gold traded in that minute, and confirm anything impossible against a second data source. Look closely at trades #2, #70 and #249.

3. Trades #129 and #130. #129 (times are broker server time; see test 2) bought 0.40 lots at 3,349.25 on 20 June 2025 at 16:09:42 and sold at 3,371.94. Seven seconds after it closed, #130 sold 0.40 lots at 3,371.94; it is recorded as closed on 20 September 2025 at 16:09:42 at 3,349.25, for a loss of $4.00. Using market prices, find the largest floating loss #130 would have shown while open, in dollars and as a share of the balance. What day was 20 September 2025, and was gold trading? How far is 3,349.25 from the last market prices before that close? Compare with the maximum drawdown Myfxbook publishes for this account, and with the margin and day-of-week charts in the statistics screenshots. Which explanations fit, and does any of them fit a real market trade?

4. Win rate against chance. Split the history into periods wherever lot size, holding time or entry timing changes. In each period, give random entries during the same hours the strategy's own average win and average loss as take-profit and stop-loss distances, and measure on real minute data which is hit first. Convert the average win and loss to price distances in dollars per ounce for each period, allowing for lot size and the commission. Compare the random win rate with the strategy's, in standard deviations. Do not use a 50% or fixed-holding-time baseline as the main comparison; if you also report one, label it and explain why it differs.

5. Where the edge comes from. For every trade you can, measure the market's move in the trade's favour 15 seconds, 30 seconds, 1, 5 and 15 minutes after entry, and the same after random entries at similar times. Do the same after exits. Measure how far each trade went against the position at its worst, against random trades of the same length. Then, with tick data (for example Dukascopy) for as large a sample as you can, compare each entry price with the live bid and ask at the recorded second and 15, 30 and 60 seconds earlier, and do the same for exits as a control. Report each period separately. Genuine forecasting skill, fills at stale prices (latency arbitrage against a lagging broker feed), a broker clock offset, and a timestamp convention (order time versus fill time) leave different patterns, in particular between entries and exits. Which, if any, does the data show? Could a real liquidity provider be filling such entries?

6. Sharpe ratio and risk. Calculate the annualised Sharpe ratio from daily and from monthly returns (daily closed profit ÷ start-of-day balance, cash movements excluded, weekdays without trades counted as zero; state the cash rate you use) for the full history, each period from test 4, and the last 12 months. Find published Sharpe ratios for the best funds in history, including Renaissance Technologies' Medallion Fund, and compare at the same frequency and over the same length of time. Count losing months. Note that a record of closed trades hides open losses, and say how much that matters here.

7. Size. Scale each trade in the last 12 months of the record (and, separately, in your last period from test 4) to $500 million at 1×, 12× and 24×, using the record's own position-to-balance ratio. Report the average trade in tonnes and US dollars. Look up how much gold the whole world trades in an average minute and in the hours these trades were placed (for example World Gold Council data). Compare, taking into account how many minutes the trades lasted. Estimate the cost of market impact against the recorded profit, stating the model and showing a range of assumptions. At what amount of money, at 1×, 12× and 24×, would the costs use up all the profit?

8. Leverage. Apply 12× and 24× to every trade's worst floating loss. Would any 12× or 24× account have survived #130, or any other trade?

9. The money. Average monthly result × 24, and the investors' 70% of it: what does that compound to over the life of the record? On about $500 million, how much profit would have been credited each month recently, and how does that compare with the new money arriving (use the monthly TRON hub data in the pack and scale it by the TRON hub's share of all inflows: TRON hub in ÷ about $1.14 billion, both in the wallet workbook; the monthly file ends 30 September 2026)? Could the money in the wallets pay everyone at once? What has to be true for the balances shown to investors to exist?

10. The promoted copies. Check the 13 matches and the size ratio yourself. What size of account, at what leverage, would those posted trades imply? The same channel also promotes a crypto wallet and debit card (BIX) registered through the investor portal; screenshots of the posts and of the network's guide are in the pack. What does the guide show about how money can move between the portal, the wallet, the card and, later, bank accounts? Which questions would a regulator ask?

11. Regulators. Search for public warnings about TAG Markets from financial regulators (national regulators and IOSCO's I-SCAN). Report what you find with dates and links.

12. Your own tests. Design and run at least two tests we did not use, and report them whichever way they point.

13. Our mistakes. List any errors, inconsistencies or overstatements in this material, and any explanation it misses.

14. The other side. Build the strongest honest case that the record and the 24× product are legitimate. Which parts survive your tests, and which don't?

YOUR CONCLUSION
First, a table: each test, its verdict, one line of reason.
Then answer plainly, a sentence or two each, then explain:
a) Q1: is the Myfxbook record a record of real market trades at the prices shown?
b) Q2: could these results have been earned in the gold market at about $500 million and 24× (and at 12×)?
c) Q3: can the balances shown to investors exist, given the wallet data?
d) What is the most likely explanation of everything together? Give the alternatives you considered and roughly how likely each is, with your reasoning.
e) What would you advise someone who has money in this product, and someone thinking of joining?
f) How confident are you, and which single record would change your mind?
Rerun our tests, step by step
Download the audit pack above and attach the whole zip to a chat with an AI assistant that can run code (for example ChatGPT, Claude, Gemini or DeepSeek).
Paste the setup prompt first, then each stage in order. Let it finish a stage before moving on.
For stages that need market prices, the assistant will ask for gold data. Dukascopy offers free XAUUSD tick and 1-minute data; HistData.com offers free 1-minute files. The timing test needs tick data: minute bars cannot show whether a price was seconds old.
Finish with the "argue the other side" prompt. A fair check tests both explanations.
The prompts are deliberately neutral: they never say what to find. AI assistants make mistakes, which is why every prompt asks it to check its own findings. We made and corrected three mistakes of our own (see the corrections log).
Trade list (CSV, 652 rows)
Every trade, deposit and withdrawal from the public Myfxbook history, in the broker's server time. Spot-check any row against the Myfxbook page.
Loading…
Evidence archive
Screenshots of every page of the account's public history, taken on 8 October 2026, and of its statistics pages. Every row was checked against the trade list used for this analysis: 592 trades by text recognition and the remaining 34 trades and 15 deposits and withdrawals by eye. All 641 match. The 11 trades from 6 to 19 October 2026 were added from the live history page on 20 October 2026 (screenshot below) and match its totals to the cent.
Download
The full analysis workbook
Every stage of this analysis in one Excel file (28 tabs): the clean trade list and reconciliation with the site, periods, Sharpe and risk metrics, benchmarks, random-entry and timing tests, the fill check against minute prices, the size and cost model, and the conclusion tabs including the probability model. Figures are live formulas, so you can change the assumptions and see the results update.
Excel format (.xlsx), about 0.7 MB. Also opens in Google Sheets, Numbers and LibreOffice.
Download
The Sonic trades as promoted to investors
13 trades posted as "Sonic.ai TP" in the public Telegram channel XFUSION OFFICIAL in July 2026, each matched to the same trade in this record at about 501 times its size, plus two "x24" promotion posts from December 2025. The table sets every posted trade beside the record and lists a SHA-256 fingerprint for each image, so any later copy can be checked against these.
Captured 11 October 2026. Zip with 14 images, the match table and a read-me, about 0.8 MB.
Promoted copies of the Sonic trades, July 2026
"x24" promotions, December 2025
The BIX wallet and card, promoted in the same channel, 2026
Update: trades of 6 to 19 October 2026
Myfxbook history page 1 as of 20 October 2026, newest first. It shows the 11 trades added to the record (#627 to #637), trade #638 of 20 October, which falls after our cut-off, and the last trades of the earlier archive. A Myfxbook pop-up for trade #628 covers some pips and profit cells; those values were read from the same page and match the totals. SHA-256 ce97edc5374d9848f6b9803511dec4c541c848dc8910430a5ca1e9c6b2904dd4.
History, archived 8 October 2026, newest first
Statistics pages
Before you join, or bring your team
Thinking of joining now, or bringing people in?
After two years and more than $1 billion paid in, this is the most dangerous moment to arrive. Here is why, in numbers, and what to ask before you put in your money or anyone else's.
Why arriving late is the worst position
In a scheme paid from new deposits, the last money in is the money that is lost
1
Early on, it can pay everyone
When balances are small, a little new money covers every withdrawal. Early members are paid, they tell their friends, and growth looks like proof.
2
At this size, the bill grows faster than any recruitment
At 24×, about $0.55–0.95 billion is owed on the Sonic half alone and about $130–240 million of new profit is booked every month, already as much as or more than all the new crypto coming in. If people keep reinvesting, that monthly bill doubles about every three to four months.
3
Growth always slows, and then the cash runs out fast
To keep paying, new money must keep growing about 20% every month: about $1 billion a month by March 2027 and about $17 billion over the next year. No recruitment network grows like that for long. When inflows only level off, our model runs out of cash in about five months; after a shock such as regulator action, in about two.
4
New money pays for earlier members' exits
Whatever you deposit now is what is available to pay people who joined before you. When it stops, those who arrived last have the least time to get anything back.
Figures: the Myfxbook record ×24, crypto flows in TAG's payment wallets, and the scenario model on this site. Card and bank deposits would make them larger.
If you lead a team or community
Bringing people into an investment you have reason to believe is unsound is not only irresponsible. It can make you personally liable:
In the UAE, promoting or inviting people to invest without a licence is a criminal offence under Article 41 of Federal Decree-Law 34 of 2021, with prison and fines of up to AED 1 million.
People you recruited can bring claims against you for their losses, and in past collapses courts have ordered promoters to return commissions they earned.
Company structures and disclaimers do not protect the people who did the promoting (see Who is responsible).
"I did not know" gets harder to say once the evidence is public. This site, the trading record and the wallet data are all available to you and your team today.
If you are approached with an offer for your community
People inside the network report that owners and leaders of existing communities are being approached, often first through the BIX crypto card, and then offered money to bring their members across and promote TAG. If that happens to you:
Ask what the money is for. A payment for bringing your members in makes you a paid promoter of the investment, with the liability that comes with it.
Ask where it comes from. If balances are paid from new deposits, so are bonuses to leaders: your payment would come out of other investors' money, and trustees in past collapses have claimed such payments back.
Ask for the documents first: the licence, audited accounts, proof that client money is held, and liquidity-provider confirmations for the trades (see the list above).
Talk to your members before they move. Once their money is in, getting it out depends on new money still arriving.
Promotion from now on is on the record. Promotion that continues after this analysis is public is being archived and will be handed to regulators. Details →
Ask what your deal says if it all goes wrong. People inside the network report that some leaders' deals pay them a percentage of everything lost in a "black swan" event. If yours does, you would be paid when your members lose everything.
Before you put in a single dollar
Ask for these, in writing, from official and independent sources
A real broker or fund that holds your money in the market can produce every one of these within days, because regulators and auditors already require them. What matters is where the document comes from: a regulator's register, a named audit firm, a bank or a liquidity provider. Not a slide deck, a screenshot or a message from a leader.
1. A licence you can check yourself
What counts The name of the licensed company that holds your money and signs your contract, its regulator and licence number. Look it up on the regulator's own public register.
Not enough A company registration, a licence held by a different company, or "regulated" with no number.
2. Audited financial statements
What counts The last two years, audited by a named, recognised audit firm, showing client money owed and client money held. You can ask the audit firm to confirm it signed them.
Not enough Management accounts, a "report" without an auditor's signature, or an audit firm nobody can find.
3. Proof that client money is held separately
What counts A letter from the bank holding client funds (named bank, account in the licensed company's name) confirming the money is segregated from the company's own money.
Not enough "Funds are safe with our partners" with no bank named.
4. Proof of reserves against all balances
What counts An independent accountant's report comparing the money actually held (banks, wallets, liquidity providers) with the total balances shown to all clients, including 24× credits.
Not enough Wallet screenshots without the matching total of what is owed. A balance means nothing without the liabilities next to it.
5. Evidence the trades reach the market
What counts The names of the liquidity providers or prime broker, and their own trade confirmations for sample trades, including #130 and #249.
Not enough The broker's own trade history, or the Myfxbook page. Those are records the broker controls.
6. The 24× contract
What counts Written terms: who your counterparty is, how the 24× works, who pays the profit on the amplified part, and the margin-call and stop-out rules. Plus a 24× statement for June–September 2025.
Not enough A sales slide, a WhatsApp message, or "it's a bonus". If the profit on the 24× part is paid by the broker, ask from which money.
7. Who manages the strategy
What counts The person or firm trading it, and their licence to manage other people's money.
Not enough "AI", "proprietary algorithm" or an anonymous trader.
8. Withdrawal terms in writing
What counts How long withdrawals take, any limits or fees, and whether you can be paid back the same way you paid in.
Not enough Crypto-only payouts for card and bank deposits, rules that change, or limits introduced "temporarily".
9. Where to complain
What counts The legal entity, its jurisdiction, and the complaints body or compensation scheme it belongs to.
Not enough An offshore address, no complaints body, or "contact your leader".
The rule
If you get excuses instead of documents, treat it as a business that cannot show your money exists. That is exactly how schemes paid from new deposits behave: they show results, but never the money behind them. No documents, no deposit, and no bringing anyone in.
What you may hear instead, and why it does not count
Why it does not countA strategy can stay secret. Licences, audits and proof that client money exists cannot: regulated firms publish them by law. Nobody is asking for the algorithm, only for proof that the money is there.
“We are regulated.” (with no licence number)
Why it does not countCheck the register yourself. A licence held by a different company, or in a country that does not cover your account, does not protect your money.
“The audit is in progress” or “coming soon”.
Why it does not countAfter more than two years and over $1 billion paid in, an audit should already exist. Until it is published and the auditor confirms it, there is no audit.
“Look at the Myfxbook results.”
Why it does not countThat is one small account, and it contains trades no market could produce (see Six tests). It says nothing about where client money is.
“Thousands of people have been paid. Withdrawals always work.”
Why it does not countPaying the people who ask is easy while new money arrives, and it is how schemes paid from new deposits build trust. The question is whether everyone could be paid at once.
“Come and see our office and events in Dubai.”
Why it does not countOffices, events and travel cost money. They show spending, not that client money is held.
“We showed you our liquidity providers, our bank account and our MetaTrader.” (on a screen, no phones allowed)
Why it does not countA list of company names does not show that any of them filled a trade or puts up the other $23 per $1. A bank balance on one day does not show whose money it is or what is owed against it. MetaTrader shows whatever the broker's own server records. None of it answers the six tests. Ask for signed confirmations you can check directly with each company, and an independent audit. More on what was shown →
“Our leaders have made millions.”
Why it does not countCommissions are paid out of deposits. Leaders earning well says nothing about whether investors' balances are backed.
“There is insurance.”
Why it does not countInsurance does not cover trading losses. Policies cover specific events such as theft, hacking or fraud by staff. Losing money on trades is the risk you accept when you invest, and no insurer covers a strategy's losses, let alone at 24×. A "black swan" market move that wipes out the accounts would not be insured. And if the trades were never in the market, the money was not lost there: a sudden "market event" is a common way schemes explain why balances are gone, while the money paid in sits wherever it was moved. If you are told there is insurance, ask for the policy, the name of the licensed insurer and exactly what it covers, and confirm it with the insurer yourself.
“That's FUD from competitors” or “regulators don't understand crypto”.
Why it does not countThe evidence on this site comes from public records anyone can check. Attacking the messenger does not produce the documents.
“Ask your upline” or “sign an NDA first”.
Why it does not countInformation that protects investors should never need secrecy or a recruiter's permission. If you are told to keep it quiet, ask why.
“Only VIP or larger investors get that information.”
Why it does not countEvery investor's money is at the same risk. A firm that can prove its finances has no reason to ration the proof.
This is an analysis of public data and a model of what follows if the profits shown are not earned in the market, which is what every test on this site points to. It is not legal or financial advice; speak to a lawyer about your own position.
If you have money in this
The test that costs you nothing
Take your money out now. Stay out for two to three months, and watch from the outside.
If Sonic and the 24× are real, and the money really is in the market, a large part of the community could withdraw today with no delays and no problems. So ask for your money back now, starting with what you put in, and watch what happens.
Why two to three months, not one: if only a few people take their money out for a few weeks, nothing visible happens either way. If many people do, a scheme that pays withdrawals from new deposits cannot hide it for long: within two to three months the strain shows. A real business barely notices.
If it is real, you will see
Withdrawals paid in full and on time, for you and for everyone else.
No new conditions, fees or checks when you ask for your money.
No special offers to keep your money in.
No regulator action and no wave of withdrawal complaints online.
The documents many people will now ask for actually produced: liquidity-provider confirmations, audited accounts, proof that client money is held, a valid licence.
Only then, and only once you have seen the proof below, consider putting money back. You will have missed two or three months of returns, nothing more.
Red flags
You are told you will lose your place, your 24×, your rank or access to the strategy if you withdraw.
A special promotion, bonus or "end-of-year" offer appears to keep your money in.
Delays, "technical problems", withdrawal limits, or a fee to release your funds.
New KYC, source-of-funds or "proof of funds" checks that appear only when you withdraw.
Pressure from leaders: talk of "FUD", "weak hands", or that withdrawing hurts the community.
Withdrawal complaints online, leaders going quiet, channels or posts deleted.
A sudden "black swan" loss is announced that wipes out balances.
Management refuses to answer these questions in public, on the record.
Then you took your money out in time, before a collapse.
Do not put your money back without proof
Payments arriving on time are not proof. A scheme can pay withdrawals for months. Before any money goes back in, TAG must show, officially and in writing:
Confirmations from its liquidity providers, checkable directly with them, that they filled the Sonic trades and provide the other 23× of the leverage.
The total client money in Sonic and the leverage applied, in an official statement.
Audited accounts, and proof that client money is held separately and covers every balance shown.
The licence that covers its clients, checkable on the regulator's register.
No documents, no money back in. If, after months of people asking, none of this appears, then what investors have been told cannot be backed up, and you should treat it as untrue.
Ask for the full amount, not a small test. Small withdrawals are paid even by schemes that are failing.
Don't rely on one success story. Compare notes with a good number of people who have asked for their full balance: how long it took, whether they were asked for anything new, whether they were pressed to stay.
Withdraw to a wallet or bank account only you control, and keep screenshots of every request and every payment.
Never pay a fee, tax or "unlock" charge to get your own money. That is a red flag in itself.
The risks are not equal. Waiting costs you two or three months of returns at most. Staying in when it is not real can cost you everything.
What we will do during those months
Keep tracking the money moving through TAG's public wallets, month by month, and any legal or regulatory action.
Publish what we find, whichever way it points. If nothing happens, we will say so.
If TAG produces liquidity-provider confirmations, audited accounts or other official documents, we will publish them in full, next to this analysis.
Ask how much money is in Sonic. Then do the arithmetic.
The main communities can see, in their IB portals, how much of their members' money sits in the Sonic strategy. People inside the network report that three of the main communities alone show more than $1 billion. We have not seen those dashboards. But if the figure is right, here is what it means for every single trade:
Money in Sonic
Leverage
Buying power
Average recent trade
Compared with all the gold the world trades in a minute
$1 billion
1×
$1 billion
about 2.4 tonnes
about the same
$1 billion
12×
$12 billion
about 29 tonnes
about 13 times
$1 billion
24×
$24 billion
about 58 tonnes, roughly $8.2 billion
about 27 times
Same method as the size test: each trade is scaled by the record's own position-to-balance ratio. Even the $500 million management talks about fails the test. Try any figure in the calculator under Your account.
Ask for it, in writing
Ask your leader to show the total balance their community has in Sonic in the IB portal, with the date on the screen.
Ask TAG Markets for an official written statement of the total client money in the Sonic strategy, the leverage applied to it, and the liquidity providers' confirmations of the positions that leverage creates.
Then compare. If the number is large, the trades cannot have happened in the gold market. If they will not give you the number, ask why the most basic figure of the strategy is a secret.
Ask them to say it in public. Ask the founder and management to answer this site, on the record, on a public recorded call. What to ask them to say →
Ask for your full statement for June–September 2025, with every open position and its floating loss. With 12× or 24× exposure, trade #130 should appear as a large loss or a margin call. If it does not, your account was not following the market.
Ask for your money back now, starting with what you put in, then the rest. Not a small test amount. Keep proof of each request and payment, and note whether you are offered upgrades, lock-ins or bonuses instead. Profits above your deposits may later be claimed back by a trustee, so do not spend them.
Ask in writing whether your trades go to an outside liquidity provider, which one, and whether you can see the execution reports.
Check who holds your money. Ask which licensed company holds your account and look it up on its regulator's register and on your own regulator's warning list. Regulators in Austria (FMA, 20 February 2026), Luxembourg (CSSF, 10 June 2026) and Québec (AMF, 18 September 2026) have published warnings that Tag Markets is not authorised or registered there.
Keep copies of everything: statements, marketing material, messages, and the terms of any leverage or "amplify" product.
Be careful about recruiting others while these questions are open. Referral income can create legal exposure.
Talk to a lawyer or your financial regulator, but do not let that delay your withdrawal request. Nothing on this page is financial or legal advice.
Who is responsible if it goes wrong?
This site will be updated
Promotion after this date is being documented
This analysis is public. Leaders, promoters and introducing brokers who keep promoting the Sonic strategy and the 24× product from now on do so knowing what the public record shows. We are archiving that promotion: dated posts, calls, channels and the communities behind them, and who is responsible for each.
That record will be handed to regulators, and to investors' lawyers if they ask for it. Updates to this site will report what is found, under the same rule as everything else here: only what is documented and has been checked.
If you lead a community and have stopped promoting, or want to correct the record, use the right of reply under Method, or write to us.
The strategy is sold through communities: groups with their own name, branding and often their own company, running on white-label portals linked to the broker. Each layer earns from investors' deposits and trading. Each layer can also be held responsible.
What leaders and communities often believe, and what the law says
“Our community is a separate company, so the leaders are protected.”
A company shields its owners from some business debts. It does not shield individuals from their own conduct. Criminal liability is personal: a person who invites others to invest without a licence, or makes false claims about returns, can be prosecuted personally, and so can directors and managers who run or approve it.
“We have a disclaimer, so we are not responsible.”
A disclaimer cannot excuse fraud. In the UAE, as in most countries, a clause limiting liability does not hold when the conduct is fraud, gross negligence or a crime. A small-print warning also cannot undo specific promises made in presentations, chats and events, such as fixed monthly returns, "AI", insurance or 24× amplification.
“We are an education community. We don't touch the money.”
What counts is the activity, not the label. Recruiting people to open accounts and deposit money, for commissions tied to their deposits, trading or returns, is promoting an investment. UAE law makes it an offence to promote or invite people to invest money without a licence, whether or not the promoter holds the money.
“The broker told us everything is legal.”
A broker's assurance does not license anyone else. Each promoter needs their own authorisation to promote financial products where they operate. Regulators in Austria, Luxembourg, Russia and Slovenia have issued warnings about the broker itself.
“Our company is registered offshore.”
Authorities act where people live, work and hold money. Leaders based in the UAE can face UAE prosecution, asset freezes and travel bans, whatever country their company is registered in.
“We only earn commissions, not investors' money.”
If investors' balances are not backed by trading profits, commissions are paid from investors' money. After past collapses, receivers and courts have ordered promoters to give back commissions and bonuses, and prosecutors have seized them.
Routes investors and authorities can take
Route
Against whom
What it can lead to
Criminal complaint (UAE)
Anyone who promoted or invited people to invest without a licence, or made false claims
Under Article 41 of Federal Decree-Law 34 of 2021: up to 5 years in prison and/or a fine of AED 250,000–1,000,000, and the court must order the money returned. Fraud charges can apply where false claims were knowingly made. Investigations can bring asset freezes and travel bans.
Regulatory action
Unlicensed promoters, communities and the broker
Warnings, orders to stop, fines. The UAE securities regulator has introduced a licence for people who promote financial products, including through online communities.
Civil claims
Leaders, promoters, community companies, the broker
Compensation for losses caused by false or misleading promises; return of commissions earned from investors' money. Group claims are usually more practical than individual ones.
Recovery after a collapse
Promoters and investors who received more than they put in
A liquidator or receiver can reclaim commissions, bonuses and "profits" paid from other investors' money.
Claims against the broker
The broker that provides the portals, accounts and commission plans
If the communities act as its distribution channel, the broker can be asked to answer for what was promised in its name.
What decides how exposed someone is
What they said: specific promises in presentations, chats, videos and events.
What they earned: commissions, ranks, bonuses, how many levels deep.
Whether they were licensed to promote financial products.
What they knew, and when. After public regulator warnings, a previous collapse involving the same broker, and this analysis, "I didn't know" becomes much harder to claim. Recruiting after seeing the evidence adds to the risk.
If you are a leader or promoter
Stop recruiting until the questions on this site are answered with documents.
Get independent legal advice: not from the broker or the community.
Keep all records. Deleting messages or materials makes things worse, not better.
Ask the broker for the records listed under For regulators, in writing.
If you are an investor: evidence to keep
Who introduced you, which community, and every promise made: screenshots, recordings, slides, chat messages, with dates.
Commission plans and rank or bonus materials you were shown.
Proof of every deposit and withdrawal, and your account statements.
Event invitations and travel offers, if any.
This is general information, not legal advice. Laws differ between countries and change; for example, the UAE's new Civil Transactions Law took effect on 1 June 2026. Speak to a lawyer where you live and, if the people involved are in the UAE, a UAE lawyer as well.
How this could end
If the findings on this site are right, the people involved have two problems: the record has been questioned in public, and the amount of money shown to investors keeps growing. Here is what to watch for, how similar schemes have ended, and what you can do now.
The question everyone ends up asking
When could it end?
Nobody can name a date: the people running it decide when payments stop. But the numbers and the history of similar schemes give clear ranges. To be fair to TAG, we used assumptions that favour it: the operator keeps only 20–50% of each new deposit, not the roughly 86% the wallet data suggest.
Best case for TAG
9–13 months
Mid to late 2027, at the very latest
Chance once public: 10%
Only if new money keeps growing about 25% every month, as it did in 2026, and the operator pays out far less than the wallets show. Even then, it hits a ceiling no model can lift. By June 2027 the new money needed from today would pass $8 billion, twice the largest crypto scheme ever (OneCoin, about $4 billion). By October 2027 it would pass $20 billion, more than Madoff collected in decades, with about $4.5 billion a month still needed. No recruitment network has ever come close.
Counted from the start, that would mean about three years of TAG's payment wallets and two years of the "x24" offer, already at the top end of how long schemes like this have lasted. The two years already gone are not extra time left: they are what built the balances the countdown starts from.
Most likely
5–10 months
Roughly March to August 2027
Chance once public: 45%
New money stops accelerating, as it does in every recruitment network. If it levels off, the cash runs out in 5 to 10 months. Slow growth buys only a few months more.
It may already be starting. Since April 2026 the number of deposits into TAG's TRON hub has stayed between about 12,500 and 17,400 a month, while the amount paid in tripled. The growth now comes from bigger deposits, not from new people.
Similar schemes lasted about as long: BitConnect's lending scheme about a year, PlusToken about 13 months, Mirror Trading International, also sold as automated trading through a broker, about 20 months. TAG's payment wallets have been taking money for 24 months; the "x24" offer for 12.
Worst case
Weeks to 3 months
From the moment the truth spreads
Chance once public: 45%
When the evidence spreads and regulators act, three things happen at once: withdrawal requests jump, recruitment stops and new money dries up. In our model that runs out of cash in 1 to 3 months. In practice, payments can stop sooner: BitConnect closed about two weeks after the first official cease-and-desist orders in January 2018.
And there is no lower limit. A "pause" for an "audit" or "migration" can be announced on any day the operator chooses.
How likely is each?
These are our judgements, not calculations: no formula gives the odds of a scheme ending. They weigh the model above, the history of similar schemes, and what TAG's own wallet data show right now.
Before this analysis is public
15%60%25%
Once it is public and regulators are informed
45%45%10%
Dark red: worst case (weeks to 3 months). Light red: most likely (5 to 10 months). Gold: best case for TAG (9 to 13 months). Left to right: worst case (weeks to 3 months), most likely (5 to 10 months), best case for TAG (9 to 13 months).
The bottom line
Once this is public, we put the chance that payments stop within about 10 months at about 90%, and within 3 months at close to one in two. The chance it survives beyond late 2027 is, in our view, close to zero.
What the wallet data show right now
TAG's TRON payment hub, month by month. More money is still coming in, but the pattern underneath has changed:
Month (2026)
Paid in $M
Paid out $M
Deposits
Withdrawals
Withdrawals per deposit
Average deposit
January
6.7
6.4
6,629
3,830
0.58
$1,004
March
9.6
9.3
8,463
5,812
0.69
$1,133
April
21.4
21.7
13,346
8,837
0.66
$1,602
May
26.3
25.0
15,059
13,374
0.89
$1,749
June
30.5
28.8
13,562
14,888
1.10
$2,250
July
35.0
37.6
12,500
18,184
1.45
$2,801
August
49.4
47.7
13,769
20,527
1.49
$3,589
September
64.9
59.6
17,357
21,376
1.23
$3,739
More people taking money out than putting it in
Since June 2026, withdrawals have outnumbered deposits every month. In January there were about 6 withdrawals for every 10 deposits; in July and August about 15.
Fewer new people, bigger cheques
The number of deposits has barely moved since April, but the average deposit has more than doubled, from about $1,600 to about $3,700. The growth now comes from larger amounts, likely existing members and leaders adding more, not from new people joining.
Everything that comes in goes out
Each month, what is paid out is between 92% and 108% of what is paid in. There is no cushion: if new money falters, withdrawals cannot be met.
Counts are blockchain transactions, not unique people: one person can make several deposits or withdrawals. October 2026 is not yet included.
Why we weigh it this way
Best case, 10%: it needs new money to keep growing about 25% a month for another year. The number of new deposits has already stopped growing, and withdrawals are growing faster than deposits.
Most likely, 45%: recruitment levels off on its own, as it does in every network, and the cash runs out within months. The wallet data suggest this is already starting.
Worst case, 45%: once the evidence is public, withdrawals rise and recruitment slows at the same time, the path in our model that runs out in 1 to 3 months. Past schemes stopped paying within weeks of official action. It is not higher because TAG has already survived warnings from regulators in several countries, and an operator can stretch things with limits and delays.
Why it cannot go on forever
At 24×, the scheme books about 27% a month on balances: about 19% for investors, the rest as commissions and the broker's fee, all of it owed or paid out. If everything stays in, the roughly $0.55–0.95 billion already shown on screens for the Sonic half alone would reach about $2.3–4 billion in six months, $10–17 billion in a year, $170–300 billion in two years, and in under five years more than all the wealth on Earth (about $500 trillion). That is absurd, and that is the point: the promise has to break long before.
Why Madoff lasted decades and this cannot
Madoff promised about 1% a month, roughly what the Sonic record shows at 1×, and that let him run for decades until the 2008 crisis brought a wave of withdrawals. The 24× product promises about 24 times as much, so the hole grows about 24 times faster. A scheme that lasted decades at 1% a month will not last long at 27%.
Brings the end closer
Pushes it later
Public exposure, regulator warnings or investigations
Faster recruitment, new countries, new promotions
A wave of withdrawal requests
Lower payouts to leaders and operators
Fewer new members, smaller deposits
Withdrawal limits, lock-ups, "reinvest" pressure
The operator deciding to stop
Lowering the monthly results (the "slow fade")
In plain words
The question is not whether it ends but when, and who is still holding a balance when it does. Every month the number on your screen grows, and so does the hole behind it. Only money that is back in your own bank account is safe.
Ranges come from the scenario model on this site (the record's results at 24×, about 3.3% of balances withdrawn a month, balances owed of $1.0–1.9 billion, investors keeping 70% of the profit, the operator keeping 20–50% of new deposits) and from the published histories of the schemes named. Months are counted from October 2026 and start from today's balances, so the time already passed is built in. The best case is capped where the new money needed exceeds what any scheme has ever collected. Using only the Sonic half halves both the balances owed and the new money, so the timings stay the same. They are not predictions of a date. This is not financial or legal advice.
Warning signs to watch for
A "black swan" loss
People inside the network report that some of TAG's deals with the main leaders include a clause: if the strategy suffers a "black swan" event, the leaders receive a percentage of everything that is lost. We have not seen these contracts. A clause that pays promoters when investors lose everything only makes sense if a large loss is expected, or planned as the ending.
What to do: if a sudden "black swan" loss is announced, ask for the trades and the liquidity providers' confirmations behind it. A real market loss at 24× would show in the public record. Ask your leader directly whether they have such a deal.
Whole communities bought in
Instead of recruiting investors one by one, the network approaches existing communities and companies that have them, often first through the BIX card, then offers their owners and leaders money to bring everyone across and promote TAG. People inside the network report this is already happening.
What it means: a scheme that needs new money to speed up has to find it in bigger and bigger blocks. Paying leaders for their audiences is a sign the ordinary pace is no longer enough. What to do: if your community is being courted, ask the questions in "Thinking of joining?" before anyone moves.
The public record changes
The Myfxbook account is made private or deleted, its history is shortened with a new start date, or trades such as #130 disappear.
What to do: We archived all 33 history pages on 8 October 2026. Compare anything new with the archive.
A new name or a new account
The strategy is renamed or "upgraded", investors are moved to a new account, broker or company, and a fresh record starts from zero.
What to do: A clean new record says nothing about the old one. Ask what happened to the old account and its money.
A new story
A "technical issue", "server migration", "hack" or "regulatory review" explains away the findings or delays payments.
What to do: Ask for the records listed under Method → Right of reply. A real explanation comes with documents.
Harder to withdraw
New fees, higher minimums, longer processing, repeated identity checks, lock-up periods, bonuses for not withdrawing, or balances turned into tokens, credits or points.
What to do: These protect cash, not investors. Request withdrawals in writing and keep the replies.
A push for new money
Limited-time offers, bigger referral bonuses, new leverage tiers, or events promising exclusive access.
What to do: A scheme paid from new deposits needs inflows to keep up with withdrawals. Watch for urgency.
Pressure on critics
Legal threats, claims that critics are competitors or spreading fear, or requests to stop sharing analysis.
What to do: Everything here can be checked independently. Pressure is not evidence.
The test that costs you nothing
Take your money out now. Stay out two to three months, and watch.
Do not put money back unless TAG produces official proof: liquidity-provider confirmations, the total money in Sonic, audited accounts, a valid licence. Payments on time alone prove nothing. If you hit delays, new checks, fees, "special offers" or warnings that you will lose your place, you got out in time. We will keep tracking the wallets and the legal side and publish what we find, whichever way it points.
The biggest risk
If many people ask for their money at once
In a scheme where balances are not backed by trading profits, the cash available at any moment is what new investors have recently deposited, minus what has already been paid out and spent. Every withdrawal, every commission and every marketing cost comes from that same pool.
Public blockchain data shows how fast money is coming in: TAG's main TRON payment wallet took $49 million in August 2026 and $65 million in September, eight times as much in three months as in its whole first year, while keeping almost none of it. Across all of TAG's crypto wallets that is roughly $190 million and $250 million (see Follow the money). Fast-growing inflows are exactly what keeps such a scheme paying. They also mean the amount owed to investors grows every month.
The danger is a run. When enough people ask for their money at the same time, because inflows slow, doubts spread, or a regulator acts, the first requests are paid. Then come delays, limits, new fees and finally a freeze. Those who ask last get least, or nothing.
Ask for your money back now
If you have money in this, asking for it back is your right, and on everything this site shows, the safest thing you can do for yourself. Do not wait for the next payout, a bonus or a "better moment": when payments stop, they stop for everyone at once, often without warning.
Start with what you put in. Money up to your own deposits is your money coming back.
Then take out the rest, if the platform lets you.
Keep proof of every step: screenshots of each request with the date, replies from support, and the transaction hash of every payment you receive.
Refuse alternatives. Upgrades, lock-ins, bonuses, "reinvest instead", or a request to deposit more to unlock a withdrawal are warning signs, not offers.
A delay or refusal is evidence. Write it down and report it.
Two honest warnings
Profits above what you put in may not be yours to keep. After past collapses, court-appointed trustees have recovered such "profits" from investors, because they were paid with other investors' money. Keep them separate, do not spend them, and get advice.
Withdraw and report. Not one or the other. Reporting early lets regulators freeze what is left before it is moved. That protects you if your own withdrawal does not get through, and it protects everyone who cannot get out in time.
When people start seeing this
Three things happen at once, and they pull in opposite directions
1. Some rush to withdraw
The first people to understand ask for all their money at once. Withdrawals jump.
2. Promoters slow down
Leaders recruit less, or with less conviction. New deposits fall.
3. Others keep compounding
Many trust their screen and keep reinvesting at 24×. What is owed keeps growing about 19–27% a month.
In plain words
Less money comes in, more goes out, and what is owed to those who stay keeps growing. Cash runs down from both ends while the debt rises. In our scenario model this "shock" path runs out of cash in about two months. Those who withdraw first are paid with the money of those who stay.
What the people in charge often do
The usual playbook when a scheme starts to fail
These are patterns seen in past collapses of schemes paid from new deposits, not predictions about any named person. Knowing them helps you recognise the stage you are in.
New faces at the top
Founders "step back". A new CEO, director or company is announced. The people who held real control often never appeared in public presentations, and the ones left in front are the ones who take the blame.
A new story
A hack, a technical migration, an audit, a "regulatory review", or a liquidity-provider failure explains why payments are slow.
A new address
The website, the client area or the app moves to a new domain or a new company name. Clients are asked to log in somewhere new, re-register or "migrate" their accounts, and old links stop working.
A new product in the spotlight
Promotion quietly moves away from the strategy and onto something else, such as a card, a token or a new "ecosystem". Members are encouraged to move their balances into it rather than withdraw them.
Leaders go quiet
Fewer public Zooms and livestreams, fewer recordings, posts deleted or switched to private groups. Leaders who were everywhere become hard to reach.
Events move elsewhere
Trips and events that used to bring investors to one city move to other cities and countries, often away from where the regulators and the press are paying attention.
Gates on withdrawals
Limits, new fees, repeated identity checks, lock-ups, or balances converted into tokens, credits or a "new platform".
Money moved
Funds are moved to new wallets, exchanges or companies. On the blockchain this is visible: watch the three hub wallets listed under Follow the money.
Key people leave
Organisers relocate before or as payments stop, which makes them much harder to reach.
Blame elsewhere
Critics, regulators, a "rogue trader" or the market are blamed. Investors are asked to stay patient and keep quiet.
Two ways it could be wound down
The slow fade, and the pause-and-gamble
Neither has to be announced as a collapse. Both can be presented as normal business decisions. Both leave the people who stay until the end holding the loss.
Ending 1
The slow fade
Monthly results at 24× are lowered step by step: from around 20% to 15%, then 10%, then less. The likely explanation: "the strategy now manages so much money that returns are diluted."
What it does: the product stops being attractive. Recruitment slows, more people withdraw, and new money no longer covers them. The balances already shown on screens, built up by months of 24× compounding, do not shrink. Those who leave early are paid; those who stay hold balances that cannot be paid.
It may already have started. The record's monthly result at 24× averaged about 32% until September 2025 and about 23% since, as deposits multiplied. .
Why the excuse does not hold: if size limited the strategy, it did so long ago. At 24×, trading costs overtake the recorded profit from about $30 million; the roughly $500 million said to be in Sonic is more than 15 times that. A real strategy would not credit 24× results for two years and only then discover it is too big.
Watch for: results drifting down month after month, new "tiers" or lock-ins "to protect returns", and pressure to reinvest rather than withdraw.
Ending 2
The pause and gamble
Withdrawals are suspended for a "restructuring", "audit", "migration" or "security review". Meanwhile, whatever money is left can be put into high-risk bets, for example leveraged crypto, in the hope that a bull run fills the hole before anyone checks.
What it does: investors' money is used for something they never agreed to. If the bet fails, the money is gone and the "market" is blamed. Even if it wins, it shows the money was never invested in the Sonic strategy as investors were told.
Why it matters now: the longer a pause lasts, the more time there is to move money out of reach. Pauses are when early complaints to the authorities count most.
Watch for: any suspension of withdrawals without a firm date, requests to sign new terms or waivers, and large movements out of the hub wallets listed under Follow the money.
In plain words
Whether results are lowered slowly or payments are paused, the hole is the same size: the balances shown on screens against the money actually held. Neither path fills it. Both decide who absorbs it, and it is always those who stay last.
If regulators act: what usually happens
The company's main office is in Dubai, so UAE authorities are likely to be among the first to ask questions. In the UAE, the bodies that may become involved include the federal Securities and Commodities Authority (which licenses investment activity and publicly warns about unlicensed firms), the Central Bank and banks' own compliance teams, Dubai Police and the Public Prosecution. Action there can be fast. Based on how similar cases have gone, the sequence usually looks like this, though not every step always happens:
1
Questions
Regulators ask the company, the broker and their banks for records: licences, client agreements, where investor money is held, and how trades are executed.
For investors: Business may continue while they look.
2
Warnings and suspension
Public warnings to investors, suspension of licences, orders to stop taking new money. Regulators in Austria, Luxembourg, Russia and Slovenia have already issued warnings about the broker.
For investors: New deposits slow or stop. Without inflows, withdrawals become harder to pay.
3
Accounts frozen
Prosecutors or courts can freeze bank accounts and assets of the companies involved, and often of their managers and leading promoters. Banks and payment providers stop processing payments.
For investors: Withdrawals stop completely. Balances on screens become claims, not money.
4
Investigation
A criminal investigation can bring arrests, seizure of property, and travel bans for people under investigation, which are commonly used in the UAE. Other countries may open their own cases.
For investors: Months to years. Information may be limited while it runs.
5
Recovery
A court-appointed liquidator, receiver or the prosecution collects what can be found and invites claims. In past cases investors recovered part of their money, sometimes after years.
For investors: You file a claim with your records. Some money comes back; usually not all.
6
Clawbacks
The recovery side can sue promoters for commissions and investors who took out more than they put in, to share it with those who lost.
For investors: Profits already withdrawn may not be safe.
What a claim is usually based on
In past cases, investor claims have usually been counted as money put in minus money taken out, not the balance shown on screen. In the Madoff case, US courts upheld this method. Profits that were only ever shown on a screen are generally not recognised.
Get ready now, whatever happens
Keep proof of every deposit: bank transfers, card receipts, crypto transaction IDs.
Keep proof of every withdrawal you received.
Save your account statements and the terms you signed.
Note who introduced you and what you were told, with dates.
Another danger: a "market event"
A common ending is a sudden, large loss blamed on the market: a crash, a "black swan", extreme volatility. With leverage, accounts are closed automatically when losses reach the deposit, and balances go to zero.
If the trades are kept on the broker's own books, that one event also wipes out everything the broker owes investors. It looks like bad luck. It ends the problem of the growing balances.
The amounts involved are small. At 24×, with position sizes like this account's recent trades, a move of about 13% against the position erases a deposit. With the larger positions of 2025, a move of 1–4% would. In early 2026 gold's daily moves were typically 2–3%.
If it happens, check it
Note the exact date and time of the loss in your statement.
Look up gold's real prices at that time (HistData.com and Dukascopy are free).
Ask: did gold actually move enough, at that time, to cause a loss that size?
Ask other investors whether every account was closed at the same moment and price.
A loss that real prices cannot explain is evidence. Keep your statement before anything changes.
Other common endings: withdrawals frozen for "maintenance" or an "audit"; balances moved to a new platform or token at a loss; the platform going offline; or a regulator or court taking control, after which investors usually recover only part of their money.
How similar cases ended
The first case involves the same broker and a strategy pitched under the same name; the details are as reported, not verified by us. We are not saying this strategy is one of the other cases. They show how schemes that made similar claims have ended, and who was held responsible.
Case
What it claimed
Size
Outcome
Stratify (same broker)
Copy-trading returns marketed to an existing online community, with "Sonic AI" named as the trading strategy
Not reported
Investigative site BehindMLM reported that around 1 April 2026 the broker disabled returns and investors said they could not withdraw. The community ended its contract with the scheme and the broker; the broker said the money would go into a shared pool divided by deposit size. Source
The Traders Domain (US regulator case)
Leveraged pools trading gold (XAU/USD); promoters said it had "never had a losing month" and showed app balances of hundreds of millions
At least $283 million in losses across at least 2,046 customers, according to the CFTC
Withdrawals stalled in late 2022. The CFTC charged 16 defendants in September 2024, alleging falsified trading records and app balances that did not reflect real trading, and that much of the money never reached any broker. A court-appointed receiver now handles claims. CFTC · Case summary
EminiFX (US)
Forex trading with an "AI" robo-advisor; at least 5% a week promised
About $260 million from tens of thousands of investors
Founder pleaded guilty and was sentenced to 9 years in prison (July 2023). A court-appointed receiver recovered about $173 million. Source
Mirror Trading International (South Africa)
Leveraged forex trading with a proprietary "bot"
At least 29,421 bitcoin (over $1.7 billion) from about 23,000 participants
US regulator (CFTC) charged the company and its CEO in June 2022, alleging all the bitcoin was misappropriated. The CEO, a fugitive, was detained in Brazil; a US court later ordered him to pay $3.4 billion. Source
IcomTech (US)
Crypto mining and trading with guaranteed profits
Paid earlier investors with newer investors' money
Founders were convicted. A senior promoter was sentenced in December 2025 to 71 months in prison and ordered to forfeit $1.5 million; prosecutors called his recruiting role critical. Source
Madoff (US)
Steady, smooth returns from claimed trading
About $50 billion sought by the trustee
After the collapse, the court-appointed trustee sued investors who had withdrawn more than they put in, to recover the "fictitious profits" (2010 onwards). Source
The risk does not stop at the founders
For promoters
In past cases, people who recruited investors and earned referral commissions have been charged, sent to prison and made to give up what they earned, even when they did not run the scheme. If you have earned commissions, take legal advice before recruiting anyone else.
For investors who withdrew profits
After a collapse, a court-appointed trustee can try to recover money from investors who took out more than they put in, because those "profits" were other investors' money. In the Madoff case, hundreds of investors were sued this way. Keep full records of what you deposited and withdrew.
What you can do now
Save your records today: full account statements, deposit and withdrawal confirmations, the terms of any leverage product, and marketing messages. Records can change or disappear.
Archive public pages: save the Myfxbook page and any promotional pages with the free Wayback Machine at web.archive.org.
Do not add money until the questions on this site are answered with documents.
Request your withdrawals in writing and keep every reply.
Talk to other investors and compare statements, especially for June–September 2025.
Report it: to your country's financial regulator, with your statements. Early reports give regulators the chance to freeze assets for everyone.
Act before people leave: in the UAE, a criminal complaint to Dubai Police or the Public Prosecution, or a civil claim before the courts, can lead to precautionary measures such as asset freezes and travel bans on the people named. Those measures are decided by prosecutors and judges, and only on complaints filed early enough. Group complaints with documents carry more weight. A UAE lawyer can advise which route fits.
Ask for the crypto to be frozen: Tether (USDT) and Circle (USDC) can freeze tokens at specific addresses when law enforcement asks. Include the hub wallet addresses from Follow the money in your complaint so the police can make that request.
Write down who you dealt with: names, roles, companies, dates, events, and who presented, recruited or signed. Give it to the authorities rather than posting accusations online.
Get advice: a lawyer, or your country's financial regulator. Nothing on this site is financial or legal advice.
For regulators, journalists and lawyers
This site is an independent analysis of public data. Everything on it can be reproduced: the trade list, every page of the original history, the price sources and the method.
Public regulator warnings about Tag Markets
Austria, FMA, 20 February 2026: Tag Markets / T.M. Financial Ltd / Tag Markets Ltd (www.tagmarkets.com) is not authorised to conduct securities transactions in Austria that require a licence. Listed on IOSCO's international alert network (I-SCAN) and relayed by Norway's Finanstilsynet.
Luxembourg, CSSF, 10 June 2026: warning concerning the website www.tagmarkets.com, filed under "illicit activities": not supervised by the CSSF and not authorised to provide investment services in or from Luxembourg.
Québec, AMF, 18 September 2026: Tag Markets (T.M. Financials Ltd) is not registered with the AMF and not authorised to solicit investors in Québec.
These warnings concern licensing in each country. They do not by themselves establish fraud. Check them on the regulators' own sites: fma.gv.at, cssf.lu, lautorite.qc.ca, iosco.org/i-scan.
The findings in one paragraph
Myfxbook account 12076857 ("Sonic AI", broker Tag Markets) shows 637 gold trades from 4 November 2024 to 19 October 2026 and $34,908.40 profit. The record contains entries no market could produce, including a position closed on a Saturday at a price about $280 from the market (#130) and fills $126–134 from the market (#249). Since September 2025 its edge comes from entries filled at prices 30–60 seconds old, a pattern that outside liquidity providers normally reject. Its Sharpe ratio since November 2025 is 24. Scaled to about $500 million (roughly half of the $1.14 billion of crypto paid into TAG's payment wallets since October 2024, the share management says is traded with Sonic) at the 24× investors are sold, each trade would be more than ten times the world's gold volume per minute and market impact costs would exceed the recorded profit several times over. The evidence is consistent with trades kept on the broker's own books, and inconsistent with real market execution at that size.
In 2026 the same community channel began promoting a crypto wallet and Visa debit card, BIX, registered through the investor (IB) portal. The network's guide describes money moving "IB-Portal → BIX-Wallet → Directly to the Debit Card", cards from $9.99 to a $25,000 gold card, a compensation plan of "up to 60%" and planned SEPA and SWIFT accounts. The issuing bank is not named in public material. People inside the network also report that the main communities can see in their IB portals how much money is in Sonic, that three of them alone show more than $1 billion, and that some leaders' deals pay them a percentage of losses in a "black swan" event. The total client money in Sonic, the leverage applied and the leaders' contracts should be obtained. People inside the network report that the card is also used as a first contact with other communities and companies, whose owners and leaders are then offered payments to bring their members to TAG. Whether TAG or IB-portal balances can be moved to the card, who issues it, and what payments leaders receive should be established. Details →
Investors report that at a private presentation, where phones were not allowed, members of the network's management showed a list of liquidity providers, a bank balance and MetaTrader accounts on a screen. None of these is a document anyone can keep or check, and none addresses the trading record. Written confirmations from the named liquidity providers, obtained directly from them, would settle whether the trades and the 24× exposure were ever placed with them.
Records that would settle it
Broker: order and fill logs with millisecond timestamps; whether each trade was passed to an outside liquidity provider, with that provider's confirmations; the audit trail for trades #2, #70, #129, #130 and #249; the $950.50 balance difference.
Strategy operator: how investor money maps to this account (allocation, copy-trading or managed-account records); the terms of the "24×" product.
Banks and payment providers: card and bank-transfer deposits received, and where they are held. TAG pays out only in crypto, so money paid in by card or bank and not yet withdrawn should still be in these accounts. Also subscription and redemption flows, to show whether withdrawals are paid from trading gains or from new deposits.
Crypto payments: confirmation that the three hub wallets listed under Follow the money are TAG's, the destinations of their outflows, and where client money is held, given that about $13 million sits in them against the more than $1 billion investors are told about.
Promoters: materials stating the amount invested, the leverage offered and the returns promised.
For UAE authorities
Onshore activity in the UAE that can be verified
The trading analysis on this site rests on public data anyone can check. The questions below go further: they concern activity in the UAE that UAE authorities can verify directly with their own powers, quickly and without relying on this site. Each one, if confirmed, stands on its own.
1
Who is licensed to do what
Does any entity operating from the broker's reported Dubai office hold a licence from the SCA (or the DFSA, if in DIFC) to deal in, arrange or market investments, or to take on clients in the UAE? Or does it rely only on its Mauritius registration?
2
Who is promoting, and with what licence
Do the UAE-based community leaders and promoters who recruit investors hold personal authorisation to promote financial products, including the SCA licence for people who promote financial products? Promoting or inviting people to invest without a licence is an offence under Article 41 of Federal Decree-Law 34 of 2021.
3
Investor visits and events in Dubai
Are prospective investors being brought to Dubai, to the broker's office or to recruitment events, to open accounts or invest? Who organises and pays for the travel and events, how many people attend, and what is presented to them about returns, size and leverage?
4
Where the money goes
Which banks and payment providers, in the UAE and abroad, receive investors' deposits? How are leaders' commissions and bonuses paid, and from which accounts?
5
What investors are told
Do marketing materials and presentations state amounts invested, "24×" amplified accounts, fixed monthly returns, "AI" trading or insurance? Each of these claims can be compared with the trading record analysed on this site.
6
The trading itself
The broker's own records will show whether the trades on this account, and investors' copies of them, were passed to outside liquidity providers or kept on the broker's books, and why trades #130 and #249 were recorded at prices the market never traded.
If you have first-hand information
If you were invited or flown to Dubai to invest, attended a recruitment event, or were promised returns, keep the evidence: invitations, travel bookings and who paid for them, agendas, photos, recordings, presentation slides and chat messages. Give it directly to the authorities, such as the SCA or Dubai Police, rather than posting it publicly. Evidence handed to investigators is far more useful, and safer for you, than accusations made online.
Act before the evidence disappears
Much of the evidence can be deleted in minutes
Once this analysis is public, the people running the scheme will know which evidence it relies on. Some of the most useful material is also the easiest to remove, and it can be removed everywhere at once: the broker's introducing-broker (IB) portal connects it to every community and team that recruits for it, so one instruction can reach all of them.
What can be deleted
Telegram channels and groups: the "last chance to unlock X24 power" promotions, trade screenshots, rank announcements and messages from leaders. Admins can delete single messages or whole channels for every member in seconds.
Community and team material: chats, webinar recordings, presentation slides, websites and social posts of the communities and teams under the IB portal.
WhatsApp groups and private messages between leaders and investors.
The public trading record: the Myfxbook account can be made private or removed.
Internal records at the broker and at companies run by promoters, if no one has asked for them to be kept.
What cannot be deleted
Blockchain payments: every transfer into and out of the hub wallets stays on the public ledger permanently. The money can be moved on, but the trail stays.
Copies people already hold: a deleted channel survives on members' phones and computers as screenshots, saved media and exported chats.
Records held by third parties: banks, payment providers, crypto exchanges and liquidity providers keep their own records, which a preservation request can secure.
This site's archive: the full trade list and all 33 history pages were saved on 8 October 2026, and the promoted copies of the Sonic trades and the "x24" promotions on 11 October 2026, each with a fingerprint (see Evidence archive).
1
Capture the channels first
Make dated captures of the public channels and groups before any enquiry is made. Telegram Desktop's "Export chat history" saves each message with its date and ID.
2
Ask for records to be preserved
Send preservation requests to the broker, its banks and payment providers, and the exchanges where the hub wallets cash out, before or together with the first questions.
3
Collect copies from investors
Current and former members hold copies of whatever is deleted. A simple way to submit them, with the date and source, preserves what the channels no longer show.
4
Watch the wallets
Large transfers out of the three hub wallets are visible as they happen. Tether and Circle can freeze tokens at specific addresses when law enforcement asks.
5
Treat a wipe as evidence
If channels, groups and pages disappear together after publication, the timing and coordination are themselves evidence of an attempt to obstruct, and should be recorded.
If you are a member of these channels
Save copies now: export the chats, keep screenshots with the date visible, and download your account statements and payment receipts. If the channels are deleted later, your copies may be the only ones left. Give them to the authorities, not to the people who run the channels.
What we can provide
The full analysis workbook (all six stages, every formula):
The trade list and all 33 history pages, archived on 8 October 2026: see Evidence archive.
The promotional posts and the 13 promoted Sonic trades, captured from the channel with image fingerprints and the match table:
The independent price data used: HistData.com and Dukascopy 1-minute gold prices, World Gold Council volume figures.
Method, sources and corrections
How the tests were done
All 33 history pages were extracted and reconciled with the site; the 11 trades from 6 to 19 October 2026 were added from the live history page on 20 October and match its totals to the cent (637 trades, $34,908.40 profit, balance $140,481.91 on 19 October). Every test that uses only the record (ledger, win rate, Sharpe ratio, periods, size and leverage) covers all 637 trades. The tests against market prices (fills within the minute, random entries, timing, moves against the position) cover the 626 trades to 5 October 2026, because the price data we hold ends there; the new trades show the same pattern in the record itself (9 wins of 11, holds of 1 to 59 minutes). Fills were checked against two independent minute-by-minute gold price sources (HistData and Dukascopy) after working out the broker's clock, including the weeks when US and European clocks change on different dates. Random-entry and timing tests used the same hours, directions and holding times as the real trades. Costs at fund size used the square-root market impact model with World Gold Council volume figures, which is lenient for orders that must fill within minutes.
The full workbook, with every test and formula, can be downloaded from the Evidence archive.
Corrections log
7 Oct
We first reported that off-market fills in 2024–25 favoured the account 39 to 15. A flaw in the test made "worse" fills harder to count. Corrected: 39 better, 37 worse, an even split.
7 Oct
We called #130 the worst losing trade. It booked −$4.00; the worst booked loss is #117 (−$839.36).
8 Oct
We briefly treated #130 as a record of no real position, then as a real position carried $12,890 under water. The account was only added to Myfxbook on 15 June 2026, so that figure may have been calculated afterwards. We now say plainly that either reading is possible, and that neither can happen in a real market.
We invite the broker and the strategy provider to publish the records that would show this analysis is wrong. We will publish any response in full, next to the finding it addresses. Send it through Contact and updates.
Order and fill logs with millisecond timestamps and the live quote at each order, for a sample of trades since September 2025.
For each trade, whether it was passed to an outside liquidity provider, and that provider's matching fill.
An explanation of trades #129, #130 and #249, and of a $950.50 balance difference the history does not explain.
How investor money maps to this account: allocation records, custodian and administrator statements, and audited accounts with counterparty confirmations.